Comparative Study
. 2005 Feb 9;25(6):1571-8.
doi: 10.1523/JNEUROSCI.4145-04.2005.

Presenilin-1-dependent transcriptome changes

Affiliations
Comparative Study

Presenilin-1-dependent transcriptome changes

Károly Mirnics et al. J Neurosci. .

Abstract

Familial forms of Alzheimer's disease (FADs) are caused by the expression of mutant presenilin 1 (PS1) or presenilin 2. Using DNA microarrays, we explored the brain transcription profiles of mice with conditional knock-out of PS1 (cKO PS1) in the forebrain. In parallel, we performed a transcription profiling of the hippocampus and frontal cortex of the FAD-linked DeltaE9 mutant transgenic (TG) mice and matched controls [TG mice expressing wild-type human PS1 (hPS1)]. When the TG and cKO datasets were cross-compared, the majority of the 30 common expression alterations were in opposite direction, suggesting that the FAD-linked PS1 variant produces transcriptome changes primarily by gain of aberrant function. Our microarray studies also revealed an unanticipated inverse correlation of transcript levels between the brains of mice that coexpress DeltaE9 hPS1+ amyloid precursor protein (APP)695 Swe and DeltaE9 hPS1 single transgenic mice. The opposite directionality of these changes in transcript levels must be a function of APP and/or APP derivatives.


Figures
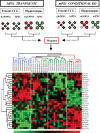
Figure 1.
Figure 1.
Experimental summary. Top, The experimental series was performed using 40 MOE430A GeneChip oligonucleotide arrays with >22,000 gene probe sets. ΔE9 hPS1 transgenic animals were compared with mice carrying the human wild-type PS1 gene, and conditional knock-out mice were compared with mice that did not undergo cre-lox recombination. The analysis was performed on hippocampus and frontal cortex tissue. Thirty genes were identified as differentially expressed across the HC and FC of both ΔE9 hPS1-wt hPS1 and cKO mPS1-wt mPS1 comparisons. Bottom, Two-way clustering of the normalized expression levels for these 30 genes separated the mouse genotypes according to their expression phenotype. In the vertical dendrogram, each arm represents a single animal (red, cKO; blue, ΔE9 hPS1; light green, wild-type mouse PS1; dark green, wild-type hPS1), and rows denote gene probe sets with National Center for Biotechnology Information accession numbers. Note that the cKO mice and ΔE9 mice show the largest Euclidian distance, whereas the wt mPS1 and wt hPS1 animals cluster adjacently. For gene names and statistical parameters, see Table 1.
Figure 2.
Figure 2.
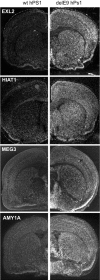
Verification of TG comparison data by in situ hybridization. Low-magnification, dark-field composite micrographs of ΔE9 hPS1 (right column) and wt hPS1 (left column) mice brain sections. Riboprobes for EXL2, HIAT1, MEG3, and AMY1A were hybridized to 20-μm-thick coronal sections using methods described previously. For the investigated genes, the in situ hybridization data were in concordance with the microarray findings.
Figure 3.
Figure 3.
Coregulation of genes across the TG and cKO comparisons. A, B, Expression changes in the hippocampus (A) and frontal cortex (B) for the 23 genes changed in the opposite direction. The x-axis represents TG comparison log2 ratio, and the y-axis denotes cKO comparison log2 ratio. C, D, Expression changes of seven genes that were regulated in a similar direction in both the TG and cKO comparisons. Graph layout is similar to that in A and B. Inserted tables in A and C denote statistical correlations across the TG and cKO comparisons and across the two brain regions (HC and FC). Note the high degree of transcript coregulation across both the TG and cKO comparisons and HC and FC.
Figure 4.
Figure 4.
Coregulation of gene expression between the ΔE9 hPS1 × APP695 double-transgenic and ΔE9 hPS1 single-transgenic animals. A, The 30 genes identified in the TG and cKO comparisons also showed robust transcription changes in the ΔE9 hPS1 × APP695 mice. The x-axis represents TG comparison log2 ratio (ΔE9 hPS1 vs wt hPS1), and the y-axis denotes ΔE9 hPS1 × APP695 versus ΔE9 hPS1 comparison log2 ratio in the hippocampus. The blue dashed line represents the trend line. Note that the 30 genes examined show a strong and inverse coregulation (r = -0.72; p < 0.001) across the two comparisons, suggesting a robust effect of APP on the ΔE9 hPS1 background. B-D, Individual gene expression changes across the ΔE9 hPS1 × APP695 versus ΔE9 hPS1 comparison. The x-axis represents sample class, and the y-axis denotes comparison log2 ratio. For gene abbreviations, see Table 1. Note that the majority of genes are regulated in different directions between the TG and ΔE9 hPS1 × APP695 versus ΔE9 hPS1 comparisons.
Figure 5.
Figure 5.
RT-qPCR verification of microarray data for seven genes. A, The x-axis represents genes, and the y-axis denotes average ΔΔCt from two independent reverse transcriptions (4 replicates each). The green bars denote TG comparison (ΔE9 hPS1 vs wt hPS1), the red bars correspond to cKO comparison (cKO mPS1 vs wt mPS1), and the blue bars indicate expression change in the APP-PS1 comparison (ΔE9 hPS1 × APP695 vs ΔE9 hPS1). Error bars denote SD. For gene symbols, see Table 1. B, Correlation of micro array data with qPCR data. Thex-axis represents qPCR ΔΔCt, and the y-axis denotes the ALR established in the microarray comparisons. Colors denote different genes, and shapes denote comparisons (triangle, TG comparison; circle, cKO comparison; diamond, APP-PS1 comparison). The green dashed line denotes the linear trend. Note that the data show a strong and significant correlation (r = 0.91; p < 0.0001).

References

    1. Anderson AJ, Cummings BJ, Cotman CW (1994) Increased immunoreactivity for Jun- and Fos-related proteins in Alzheimer's disease: association with pathology. Exp Neurol 125: 286-295. - PubMed
    1. Ball CA, Sherlock G, Parkinson H, Rocca-Sera P, Brooksbank C, Causton HC, Cavalieri D, Gaasterland T, Hingamp P, Holstege F, Ringwald M, Spellman P, Stoeckert Jr CJ, Stewart JE, Taylor R, Brazma A, Quackenbush J (2002) Standards for microarray data. Science 298: 539. - PubMed
    1. Blalock EM, Geddes JW, Chen KC, Porter NM, Markesbery WR, Landfield PW (2004) Incipient Alzheimer's disease: microarray correlation analyses reveal major transcriptional and tumor suppressor responses. Proc Natl Acad Sci USA 101: 2173-2178. - PMC - PubMed
    1. Borchelt DR, Thinakaran G, Eckman CB, Lee MK, Davenport F, Ratovitsky T, Prada CM, Kim G, Seekins S, Yager D, Slunt HH, Wang R, Seeger M, Levey AI, Gandy SE, Copeland NG, Jenkins NA, Price DL, Younkin SG, Sisodia SS (1996) Familial Alzheimer's disease-linked presenilin 1 variants elevate Abeta1-42/1-40 ratio in vitro and in vivo Neuron 17: 1005-1013. - PubMed
    1. Borchelt DR, Ratovitski T, van Lare J, Lee MK, Gonzales V, Jenkins NA, Copeland NG, Price DL, Sisodia SS (1997) Accelerated amyloid deposition in the brains of transgenic mice coexpressing mutant presenilin 1 and amyloid precursor proteins. Neuron 19: 939-945. - PubMed

Publication types

MeSH terms

LinkOut - more resources