. 2005 Jan;117(1):424-35.
doi: 10.1121/1.1828551.

Controlled ultrasound tissue erosion: the role of dynamic interaction between insonation and microbubble activity

Affiliations

Controlled ultrasound tissue erosion: the role of dynamic interaction between insonation and microbubble activity

Zhen Xu et al. J Acoust Soc Am. 2005 Jan.

Abstract

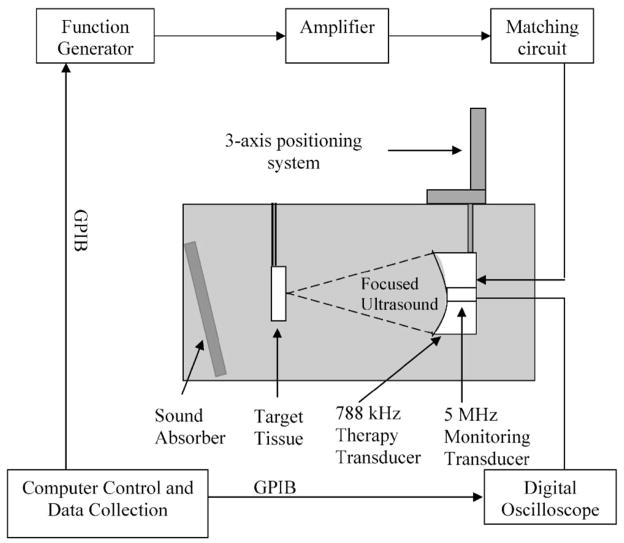
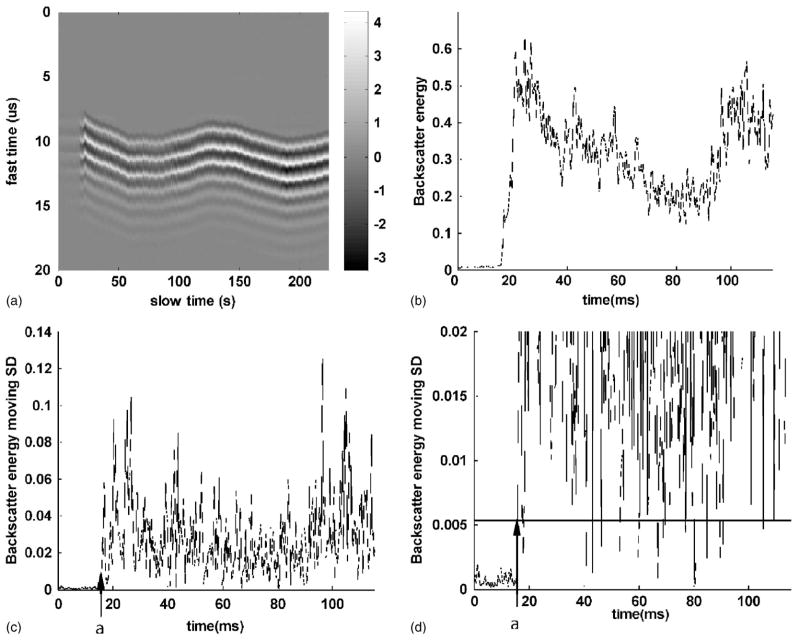
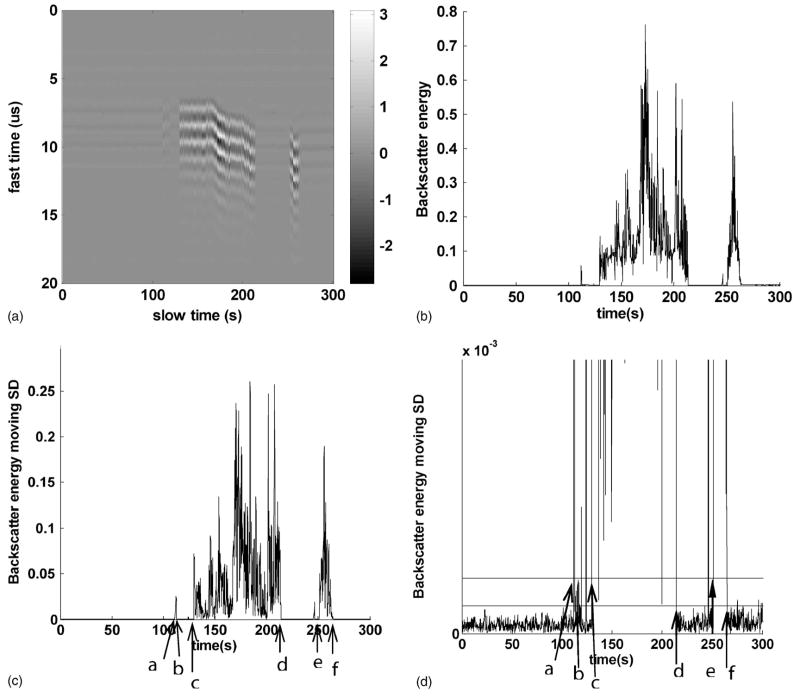
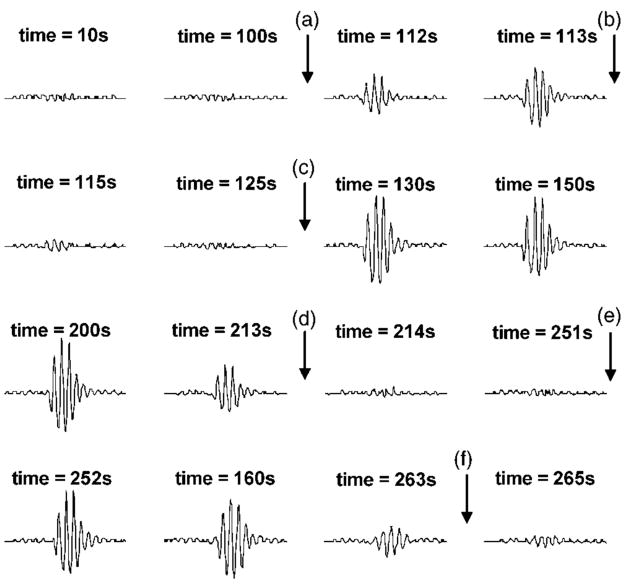
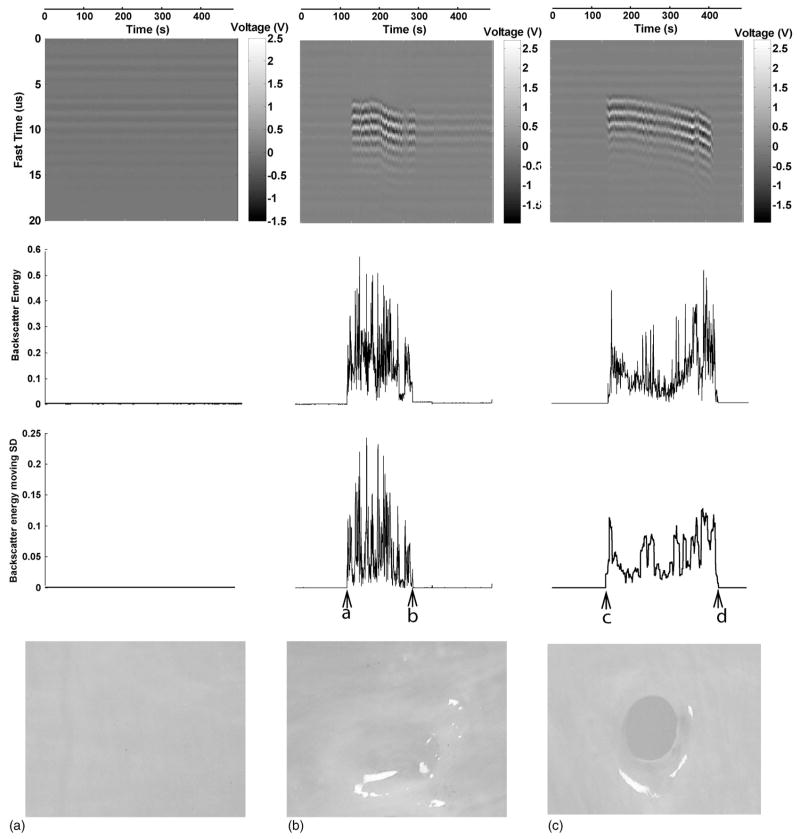
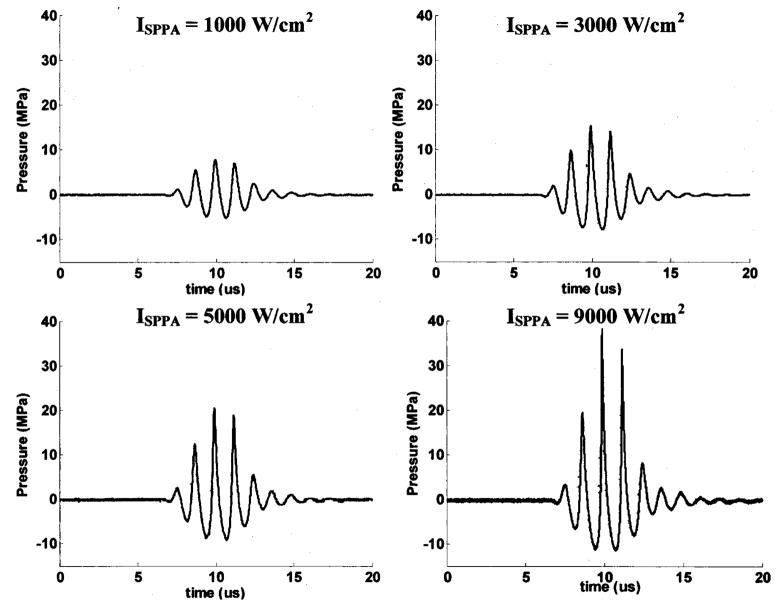
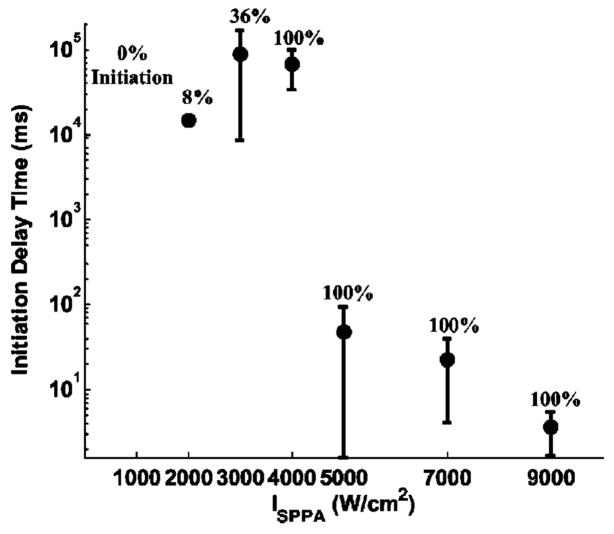
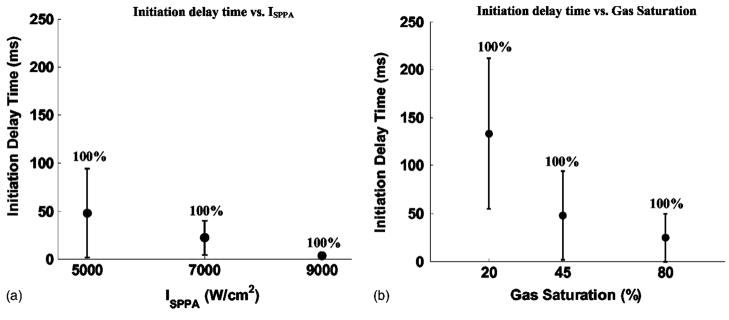
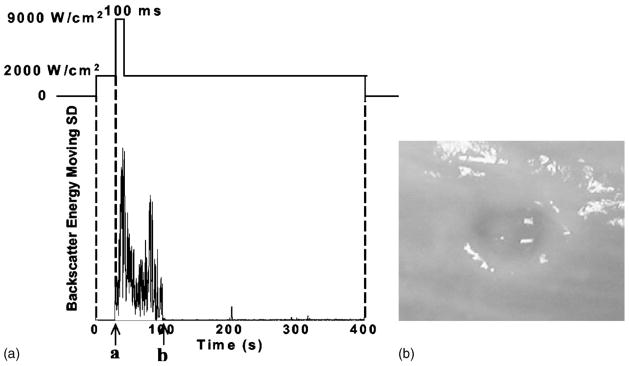
Previous studies showed that ultrasound can mechanically remove tissue in a localized, controlled manner. Moreover, enhanced acoustic backscatter is highly correlated with the erosion process. "Initiation" and "extinction" of this highly backscattering environment were studied in this paper. The relationship between initiation and erosion, variability of initiation and extinction, and effects of pulse intensity and gas saturation on time to initiation (initiation delay time) were investigated. A 788-kHz single-element transducer was used. Multiple pulses at a 3-cycle pulse duration and a 20-kHz pulse repetition frequency were applied. I(SPPA) values between 1000 and 9000 W/cm2 and gas saturation ranges of 24%-28%, 39%-49%, and 77%-81% were tested. Results show the following: (1) without initiation, erosion was never observed; (2) initiation and extinction of the highly backscattering environment were stochastic in nature and dependent on acoustic parameters; (3) initiation delay times were shorter with higher intensity and higher gas saturation (e.g., the mean initiation delay time was 66.9 s at I(SPPA) of 4000 W/cm2 and 3.6 ms at I(SPPA) of 9000 W/cm2); and (4) once initiated by high-intensity pulses, the highly backscattering environment and erosion can be sustained using a significantly lower intensity than that required to initiate the process.


Figures

FIG. 1
FIG. 1
Experimental setup. Ultrasound pulses were delivered by the 788-kHz therapy transducer. Porcine atrial wall sample was positioned at the focus of the therapy transducer. Acoustic backscatter was received by the 5-MHz monitoring transducer.
FIG. 2
FIG. 2
Process to detect initiation of the highly backscattering environment. Panels (A), (B), (C), and (D) show the steps of initiation detection in sequence. Panel (A) shows the acoustic backscatter in fast time and slow time mode. Each vertical line shows backscatter recorded as the output voltage of the monitoring transducer in fast time. Panel (B) shows the backscatter energy versus time. Panel (C) shows the moving SD of backscatter energy versus time. Panel (D) is an expanded view of panel (C). The line is the initiation threshold, set by four times the SD estimation of uninitiated backscatter energy. In Panel (C) and (D), detected by the criteria defined for initiation, the highly backscattering environment was initiated at “a.” Ultrasound pulses with a pulse duration (PD) of 3 cycles, a pulse repetition frequency (PRF) of 20 kHz, an ISPPA of 5000 W/cm2, and gas saturation of 46% were applied.
FIG. 3
FIG. 3
Process to detect initiation and extinction. Panels (A), (B), (C), and (D) show the steps of initiation and extinction detection in sequence. Panel (A) shows the acoustic backscatter in fast time and slow time mode. Each vertical line shows backscatter recorded as the output voltage of the monitoring transducer in fast time. Panel (B) shows the backscatter energy versus time. Panel (C) shows the moving SD of backscatter energy versus time. Panel (D) is an expanded view of panel (C). The line above is the initiation threshold, set by four times the SD estimation of uninitiated backscatter energy. And, the line below is the extinction threshold, set by two times SD estimation of uninitiated backscatter energy. In panels (C) and (D), detected by the criteria defined for initiation and extinction, the highly backscattering environment was initiated at “a,” extinguished at “b,” spontaneously reinitiated at “c,” extinguished again at “d,” reinitiated again at “e,” and tissue was finally perforated at “f.” Ultrasound pulses with a PD of 3 cycles, a PRF of 20 kHz, an ISPPA of 4000 W/cm2, and gas saturation of 40% were applied.
FIG. 4
FIG. 4
Waveforms of acoustic backscatter corresponding to the data in Fig. 3. All the backscatter waveforms are 20-μs-long range gated from the erosion zone. “a”–“f” are the initiation and extinction points shown in Figs. 3(C) and (D). A highly backscattering environment was initiated at “a,” extinguished at “b,” spontaneously reinitiated at “c,” extinguished again at “d,” reinitiated again at “e,” and tissue was finally perforated at “f.” Ultrasound pulses with a PD of 3 cycles, a PRF of 20 kHz, an ISPPA of 4000 W/cm2, and gas saturation of 40% were applied.
FIG. 5
FIG. 5
The first row shows the acoustic backscatter in fast time and slow time mode. The second row shows the backscatter energy versus time. The third row shows the moving SD of backscatter energy versus time. The x axis (time) for each column is the same and shown above the column. The y axis for each row is the same and shown on the left side of each row. The fourth row depicts the tissue effects on porcine atrial wall tissue samples generated by the corresponding treatments. All the tissue samples were treated by a total of 8-min ultrasound pulses at an ISPPA of 3500 W/cm2, a PD of 3 cycles, a PRF of 20 kHz, and gas saturation of 40%–45%. In panel (A), neither initiation nor erosion was observed. In panel (B), initiation (“a”) and extinction (“b”) were detected and erosion was observed, but tissue was not perforated. In panel (C), initiation (“c”) was detected and erosion was observed, and tissue was perforated (“d”).
FIG. 6
FIG. 6
The waveform of the therapeutic ultrasound signal with a PD of 3 cycles and ISPPA’s of 1000, 3000, 5000, and 9000 W/cm2 delivered by the 788-kHz therapy transducer as recorded by a membrane hydrophone. PD used in this paper is given as the number of cycles in the waveform at output of the function generator. However, the calculation of ISPPA uses the appropriate definition of the PD.
FIG. 7
FIG. 7
Initiation delay time as a function of ISPPA. ISPPA’s of 1000, 2000, 3000, 4000, 5000, 7000, and 9000 W/cm2 were tested. A PD of 3 cycles, a PRF of 20 kHz, and gas saturation range of 39%–49% were used for all the ultrasound exposures. Initiation delay time was plotted as mean and standard deviation values. The sample size is listed as number of treatments in Table VI. The number above each data point is the percentage of trial in which initiation was detected for this same set of parameters. Initiation delay time was shorter with high intensity. For example, the mean initiation delay time was 66.9 s at an ISPPA of 4000 W/cm2 and 3.6 ms at an ISPPA of 9000 W/cm2, a 4-order-of-magnitude difference (p<0.0001; t-test).
FIG. 8
FIG. 8
Panel (A) shows the initiation delay time as a function of intensity. ISPPA’s of 5000, 7000, and 9000 W/cm2 were tested. A PD of 3 cycles, a PRF of 20 kHz, and gas saturation of 39%–49% were applied to all the exposures in panel (A). Initiation delay times and variances in initiation delay times were shorter with higher intensity. For example, the mean initiation delay time was 48.0 ms at an ISPPA of 5000 W/cm2 and 3.6 ms at an ISPPA of 9000 W/cm2. Panel (B) shows the initiation delay time as a function of gas saturation. Gas saturation ranges of 24%–28%, 39%–49%, 77%–81% were tested and plotted as gas saturations of 25%, 45%, and 80% for convenience of display. A PD of 3 cycles, a PRF of 20 kHz, and an ISPPA of 5000 W/cm2 were applied to all the exposures in panel (B). Initiation delay times and variances in initiation delay times were shorter with higher gas saturation. For example, the mean initiation delay time was 133.1, 48.0, and 24.7 ms at gas saturation ranges of 21%–24%, 39%–49%, and 77%–81%, respectively. Initiation delay time was plotted as mean and standard deviation values (N=8) in both panels. The number above each data point is the percentage of trial in which initiation was detected for the same set of parameters.
FIG. 9
FIG. 9
In panel (A), acoustic pulses with an ISPPA of 2000 W/cm2 were applied from time 0 to 400 s. Panel (A) shows the moving SD of backscatter energy versus time. No initiation was detected until 100-ms 9000 W/cm2 pulses were applied at “a” (initiation). The highly backscattering environment was continued by 2000-W/cm2 pulses and extinguished at “b” (extinction). Panel (B) shows the erosion observed in the porcine wall tissues produced by the corresponding acoustic pulses. Please note that no erosion was produced at 2000 W/cm2 alone among 12 treatments tested (Table II). (All the pulses applied were at a PD of 3 cycles, a PRF of 20 kHz, and gas saturation of 42%–43%).

Similar articles

Cited by

References

    1. AIUM (1998). Acoustic Output Measurement Standard for Diagnostic Ultrasound Equipment, AIUM/NEMA.

    1. Apfel RE, Holland CK. Gauging the likelihood of cavitation from short-pulse, low-duty cycle diagnostic ultrasound. Ultrasound Med Biol. 1991;17:179–185. - PubMed
    1. Atchley AA. Thresholds for cavitation produced in water by pulsed ultrasound. Ultrasonics. 1988;26:xxx–xxx. - PubMed
    1. Belahadji B, Franc JP, Michel JM. A statistical analysis of cavitation erosion pits. J Fluids Eng. 1991;113:700–706.
    1. Bouakaz A, Frinking PJA, Jong ND, Bom N. Noninvasive measurement of the hydrostatic pressure in a fluid-filled cavity based on the disappearance time of micrometer-sized free gas bubbles. Ultrasound Med Biol. 1999;25:1407–1415. - PubMed

Publication types