Modeling the residual effects and threshold saturation of training: a case study of Olympic swimmers
- PMID: 15705048
- PMCID: PMC5352828
- DOI: 10.1519/14853.1
Modeling the residual effects and threshold saturation of training: a case study of Olympic swimmers
Abstract
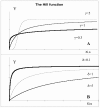
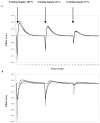
The aim of this study was to model the residual effects of training on the swimming performance and to compare a model that includes threshold saturation (MM) with the Banister model (BM). Seven Olympic swimmers were studied over a period of 4 +/- 2 years. For 3 training loads (low-intensity w(LIT), high-intensity w(HIT), and strength training w(ST)), 3 residual training effects were determined: short-term (STE) during the taper phase (i.e., 3 weeks before the performance [weeks 0, 1, and 2]), intermediate-term (ITE) during the intensity phase (weeks 3, 4, and 5), and long-term (LTE) during the volume phase (weeks 6, 7, and 8). ITE and LTE were positive for w(HIT) and w(LIT), respectively (p < 0.05). Low-intensity training load during taper was related to performances by a parabolic relationship (p < 0.05). Different quality measures indicated that MM compares favorably with BM. Identifying individual training thresholds may help individualize the distribution of training loads.
Figures


Similar articles
-
Modeling the training-performance relationship using a mixed model in elite swimmers.Med Sci Sports Exerc. 2003 May;35(5):838-46. doi: 10.1249/01.MSS.0000065004.05033.42. Med Sci Sports Exerc. 2003. PMID: 12750595 Free PMC article.
-
Modelling of optimal training load patterns during the 11 weeks preceding major competition in elite swimmers.Appl Physiol Nutr Metab. 2017 Oct;42(10):1106-1117. doi: 10.1139/apnm-2017-0180. Epub 2017 Jun 26. Appl Physiol Nutr Metab. 2017. PMID: 28651061
-
Training characteristics of paralympic swimmers.J Strength Cond Res. 2010 Feb;24(2):471-8. doi: 10.1519/JSC.0b013e3181c09a9e. J Strength Cond Res. 2010. PMID: 20072051
-
Swimming intensity during triathlon: a review of current research and strategies to enhance race performance.J Sports Sci. 2009 Aug;27(10):1079-85. doi: 10.1080/02640410903081878. J Sports Sci. 2009. PMID: 19847691 Review.
-
Effects of taper on swim performance. Practical implications.Sports Med. 1994 Apr;17(4):224-32. doi: 10.2165/00007256-199417040-00003. Sports Med. 1994. PMID: 8009136 Review.
Cited by
-
Identifying Optimal Overload and Taper in Elite Swimmers over Time.J Sports Sci Med. 2013 Dec 1;12(4):668-78. eCollection 2013. J Sports Sci Med. 2013. PMID: 24421726 Free PMC article.
-
Effects of Plyometric Training on Lower-Limb Explosive Power and Its Retention After Detraining in Sprinters.Am J Mens Health. 2025 Jul-Aug;19(4):15579883251363089. doi: 10.1177/15579883251363089. Epub 2025 Aug 13. Am J Mens Health. 2025. PMID: 40801377 Free PMC article. Clinical Trial.
-
Predicting Breaststroke and Butterfly Stroke Results in Swimming Based on Olympics History.Int J Environ Res Public Health. 2021 Jun 20;18(12):6621. doi: 10.3390/ijerph18126621. Int J Environ Res Public Health. 2021. PMID: 34202950 Free PMC article.
-
The development and prediction of athletic performance in freestyle swimming.J Hum Kinet. 2012 May;32:97-107. doi: 10.2478/v10078-012-0027-3. Epub 2012 May 30. J Hum Kinet. 2012. PMID: 23486223 Free PMC article.
-
The Use of Fitness-Fatigue Models for Sport Performance Modelling: Conceptual Issues and Contributions from Machine-Learning.Sports Med Open. 2022 Mar 3;8(1):29. doi: 10.1186/s40798-022-00426-x. Sports Med Open. 2022. PMID: 35239054 Free PMC article.
References
-
- Ali MA. Effect of sample size on the size of the coefficient of determination in simple linear regression. J Inform Optim Sci. 1987;8:209–219.
-
- American College of Sports Medicine. Progression models in resistance training for healthy adults. Med Sci Sport Exerc. 2002;34:364–380. - PubMed
-
- Banister EW, Calvert TW, Savage MV. A systems model of training for athletic performance. Can J Sports Med. 1975;7:57–61.
-
- Banister EW, Carter JB, Zarcadas PC. Training theory and taper: validation in triathlon athletes. Eur J Appl Physiol. 1999;79:182–191. - PubMed
MeSH terms
LinkOut - more resources
Full Text Sources
Research Materials
