

Integrating alternative splicing detection into gene prediction
- PMID: 15705189
- PMCID: PMC550657
- DOI: 10.1186/1471-2105-6-25
Integrating alternative splicing detection into gene prediction
Abstract
Background: Alternative splicing (AS) is now considered as a major actor in transcriptome/proteome diversity and it cannot be neglected in the annotation process of a new genome. Despite considerable progresses in term of accuracy in computational gene prediction, the ability to reliably predict AS variants when there is local experimental evidence of it remains an open challenge for gene finders.
Results: We have used a new integrative approach that allows to incorporate AS detection into ab initio gene prediction. This method relies on the analysis of genomically aligned transcript sequences (ESTs and/or cDNAs), and has been implemented in the dynamic programming algorithm of the graph-based gene finder EuGENE. Given a genomic sequence and a set of aligned transcripts, this new version identifies the set of transcripts carrying evidence of alternative splicing events, and provides, in addition to the classical optimal gene prediction, alternative optimal predictions (among those which are consistent with the AS events detected). This allows for multiple annotations of a single gene in a way such that each predicted variant is supported by a transcript evidence (but not necessarily with a full-length coverage).
Conclusions: This automatic combination of experimental data analysis and ab initio gene finding offers an ideal integration of alternatively spliced gene prediction inside a single annotation pipeline.
Figures
 and
and  .
.
 and
and  a vertex
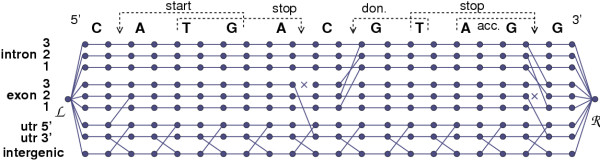
  allows the transition from the UTR5' track at position i - 1 to the exonic track at i because the A nucleotide at position i is the first nucleotide of a potential start codon ATG. The dynamic programming algorithm used in EuGÈNE determines, for each vertex r, which vertex precedes r in the optimal path. In this example, at position i for the track j the best path leading to
  from the left has a weight
  (only one origin is possible). For the track j + 1, the best path leading to
  will be attributed a weight of either
  , whatever the lower.
Similar articles
-
Plant Gene and Alternatively Spliced Variant Annotator. A plant genome annotation pipeline for rice gene and alternatively spliced variant identification with cross-species expressed sequence tag conservation from seven plant species.Plant Physiol. 2007 Mar;143(3):1086-95. doi: 10.1104/pp.106.092460. Epub 2007 Jan 12. Plant Physiol. 2007. PMID: 17220363 Free PMC article.
-
The Alternative Splicing Gallery (ASG): bridging the gap between genome and transcriptome.Nucleic Acids Res. 2004 Aug 3;32(13):3977-83. doi: 10.1093/nar/gkh731. Print 2004. Nucleic Acids Res. 2004. PMID: 15292448 Free PMC article.
-
JIGSAW: integration of multiple sources of evidence for gene prediction.Bioinformatics. 2005 Sep 15;21(18):3596-603. doi: 10.1093/bioinformatics/bti609. Epub 2005 Aug 2. Bioinformatics. 2005. PMID: 16076884
-
How prevalent is functional alternative splicing in the human genome?Trends Genet. 2004 Feb;20(2):68-71. doi: 10.1016/j.tig.2003.12.004. Trends Genet. 2004. PMID: 14746986 Review.
-
Computational methods for alternative splicing prediction.Brief Funct Genomic Proteomic. 2006 Mar;5(1):46-51. doi: 10.1093/bfgp/ell011. Epub 2006 Feb 20. Brief Funct Genomic Proteomic. 2006. PMID: 16769678 Review.
Cited by
-
yrGATE: a web-based gene-structure annotation tool for the identification and dissemination of eukaryotic genes.Genome Biol. 2006;7(7):R58. doi: 10.1186/gb-2006-7-7-r58. Genome Biol. 2006. PMID: 16859520 Free PMC article.
-
Using ESTs to improve the accuracy of de novo gene prediction.BMC Bioinformatics. 2006 Jul 3;7:327. doi: 10.1186/1471-2105-7-327. BMC Bioinformatics. 2006. PMID: 16817966 Free PMC article.
-
mGene: accurate SVM-based gene finding with an application to nematode genomes.Genome Res. 2009 Nov;19(11):2133-43. doi: 10.1101/gr.090597.108. Epub 2009 Jun 29. Genome Res. 2009. PMID: 19564452 Free PMC article.
-
nGASP--the nematode genome annotation assessment project.BMC Bioinformatics. 2008 Dec 19;9:549. doi: 10.1186/1471-2105-9-549. BMC Bioinformatics. 2008. PMID: 19099578 Free PMC article.
-
Identification of alternative 5'/3' splice sites based on the mechanism of splice site competition.Nucleic Acids Res. 2006;34(21):6305-13. doi: 10.1093/nar/gkl900. Epub 2006 Nov 10. Nucleic Acids Res. 2006. PMID: 17098928 Free PMC article.
References
MeSH terms
Substances
LinkOut - more resources
Full Text Sources
Other Literature Sources
Research Materials
