Comparative Study
. 2005 Feb 10:6:26.
doi: 10.1186/1471-2105-6-26.

Comparison of seven methods for producing Affymetrix expression scores based on False Discovery Rates in disease profiling data

Affiliations
Comparative Study

Comparison of seven methods for producing Affymetrix expression scores based on False Discovery Rates in disease profiling data

Kerby Shedden et al. BMC Bioinformatics. .

Abstract

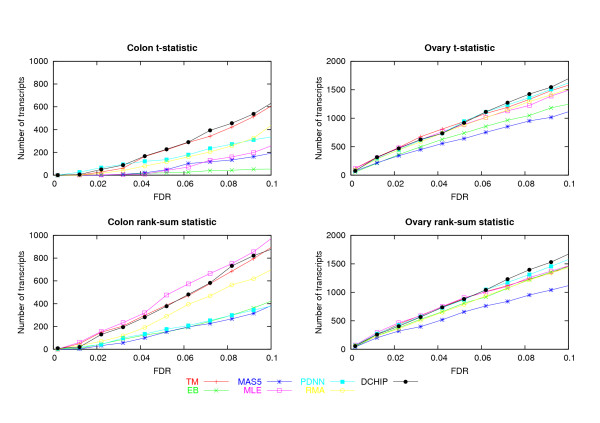
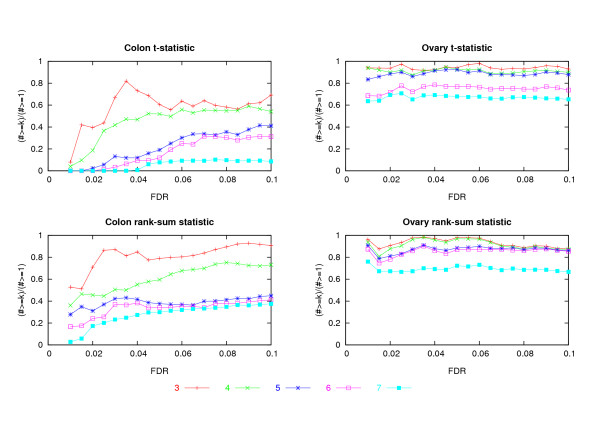
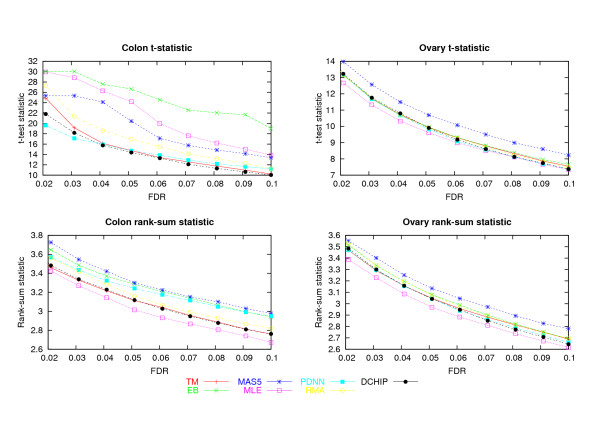
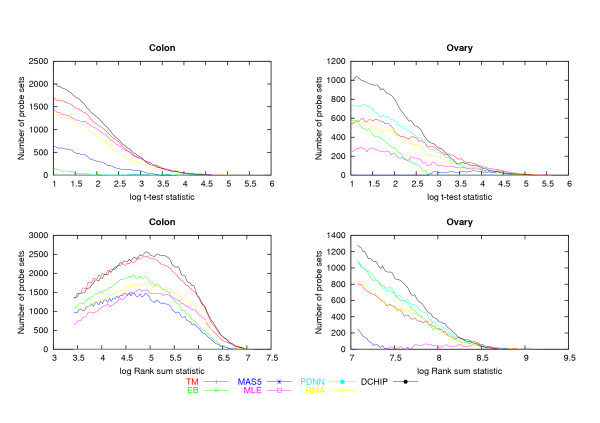
Background: A critical step in processing oligonucleotide microarray data is combining the information in multiple probes to produce a single number that best captures the expression level of a RNA transcript. Several systematic studies comparing multiple methods for array processing have used tightly controlled calibration data sets as the basis for comparison. Here we compare performances for seven processing methods using two data sets originally collected for disease profiling studies. An emphasis is placed on understanding sensitivity for detecting differentially expressed genes in terms of two key statistical determinants: test statistic variability for non-differentially expressed genes, and test statistic size for truly differentially expressed genes.

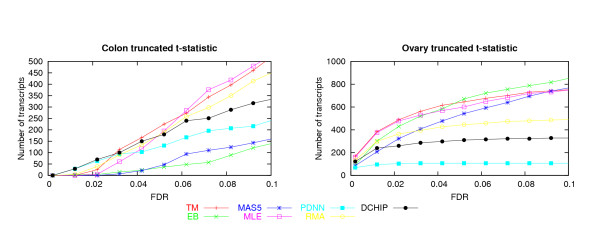
Results: In the two data sets considered here, up to seven-fold variation across the processing methods was found in the number of genes detected at a given false discovery rate (FDR). The best performing methods called up to 90% of the same genes differentially expressed, had less variable test statistics under randomization, and had a greater number of large test statistics in the experimental data. Poor performance of one method was directly tied to a tendency to produce highly variable test statistic values under randomization. Based on an overall measure of performance, two of the seven methods (Dchip and a trimmed mean approach) are superior in the two data sets considered here. Two other methods (MAS5 and GCRMA-EB) are inferior, while results for the other three methods are mixed.

Conclusions: Choice of processing method has a major impact on differential expression analysis of microarray data. Previously reported performance analyses using tightly controlled calibration data sets are not highly consistent with results reported here using data from human tissue samples. Performance of array processing methods in disease profiling and other realistic biological studies should be given greater consideration when comparing Affymetrix processing methods.


Figures

Figure 1
Figure 1
Sensitivity results for colon and ovary data. Top row: number of significant probe sets at a range of FDR0 values using the t-test statistic. Bottom row: number of significant probe sets at a range of FDR0 values using the rank-sum statistic. The left column shows the results for colon data and the right column shows the results for ovary data.
Figure 2
Figure 2
FDR agreement between methods. The ratio of the number of probe sets with FDR0 value below a given threshold in k or more of the seven methods to the number of probe sets with FDR0 value below the threshold in at least one method was calculated for k = 3, 4, 5, 6, 7, and plotted against the FDR0 threshold. Results are shown for the colon data (left column), the ovary data (right column), and for the t-test statistic (top row), and the rank-sum statistic (bottom row).
Figure 3
Figure 3
Calibration results for ovary and colon data. The threshold test statistic required to obtain a given FDR0 for each method is plotted against the FDR0 value. Results are shown for the colon data (left column), the ovary data (right column), and for the t-test statistic (top row), and the rank-sum statistic (bottom row).
Figure 4
Figure 4
Test statistics for ovary and colon data. For each of the seven processing methods, the number of probe sets exceeding a test statistic threshold t was calculated and plotted against log2 t. Results are shown for the colon data (left column), the ovary data (right column), and for the t-test statistic (top row), and the rank-sum statistic (bottom row).
Figure 5
Figure 5
Sensitivity for detecting genes with at least 50% change in expression magnitude. The number of significant probe sets at a range of FDR0 values is shown for analysis in which the test statistic is the t-statistic truncated to zero when the fold change is less than 50%.

References

    1. Bolstad B, Irizarry R, Astrand M, Speed T. A comparison of normalization methods for high density oligonucleotide array data based on variance and bias. Bioinformatics. 2003;19:185–193. doi: 10.1093/bioinformatics/19.2.185. - DOI - PubMed
    1. Irizarry R, Bolstad B, Collin F, Cope L, Hobbs B, Speed T. Summaries of Affymetrix GeneChip probe level data. Nucleic Acids Research. 2003;31:e15. doi: 10.1093/nar/gng015. - DOI - PMC - PubMed
    1. Irizarry R, Hobbs B, Collin F, Beazer-Barclay Y, Antonellis K, Scherf U, Speed T. Exploration, Normalization, and Summaries of High-Density Oligonucleotide Array Probe Level Data. Biostatistics. 2003;4:249–264. doi: 10.1093/biostatistics/4.2.249. - DOI - PubMed
    1. Rajagapolan D. A comparison of statistical methods for analysis of high density oligonucleotide array data. Bioinformatics. 2003;19:1469–76. doi: 10.1093/bioinformatics/btg202. - DOI - PubMed
    1. Cope L, Irizarry R, Jaffee H, Wu Z, Speed T. A benchmark for Affymetrix GeneChip expression measures. Bioinformatics. 2004;20:323–331. doi: 10.1093/bioinformatics/btg410. - DOI - PubMed

Publication types

MeSH terms

LinkOut - more resources