Comparative Study
. 2005 Feb 7;272(1560):267-75.
doi: 10.1098/rspb.2004.2942.

Character complexity and redundancy in writing systems over human history

Affiliations
Comparative Study

Character complexity and redundancy in writing systems over human history

Mark A Changizi et al. Proc Biol Sci. .

Abstract

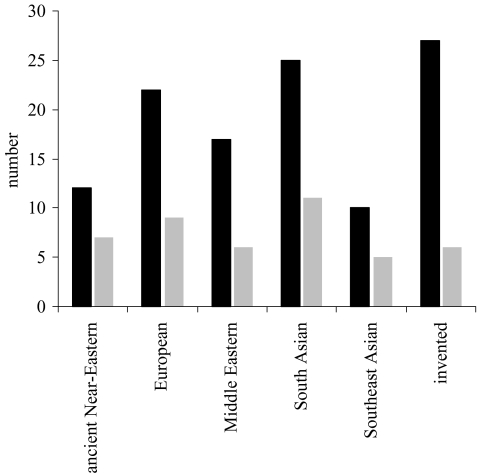
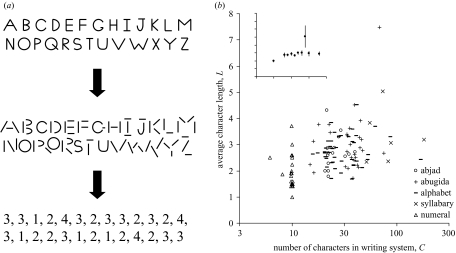
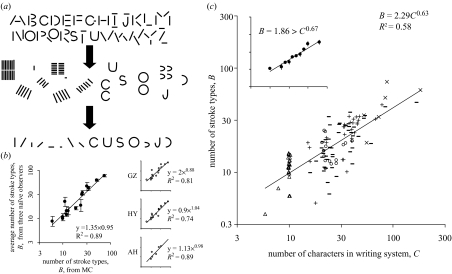
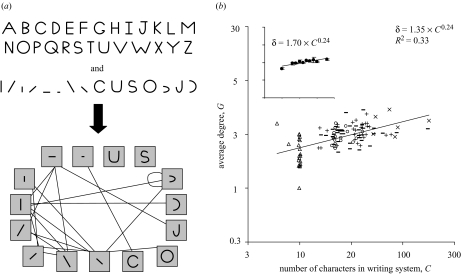
A writing system is a visual notation system wherein a repertoire of marks, or strokes, is used to build a repertoire of characters. Are there any commonalities across writing systems concerning the rules governing how strokes combine into characters; commonalities that might help us identify selection pressures on the development of written language? In an effort to answer this question we examined how strokes combine to make characters in more than 100 writing systems over human history, ranging from about 10 to 200 characters,and including numerals, abjads, abugidas, alphabets and syllabaries from five major taxa: Ancient Near-Eastern, European, Middle Eastern, South Asian, Southeast Asian. We discovered underlying similarities in two fundamental respects. (i) The number of strokes per characters is approximately three, independent of the number of characters in the writing system; numeral systems are the exception, having on average only two strokes per character. (ii) Characters are ca. 50% redundant, independent of writing system size; intuitively, this means that acharacter's identity can be determined even when half of its strokes are removed. Because writing systems are under selective pressure to have characters that are easy for the visual system to recognize and for the motor system to write, these fundamental commonalities may be a fingerprint of mechanisms underlying the visuo-motor system.


Figures

Figure 1
Figure 1
Distribution of writing systems used in the study (see table 1) across the major phylogenetic classes (black bars), and also the number of sections devoted to the phylogenetic classes in Daniels & Bright (1996) The world’s writing systems, the most exhaustive book on the topic (grey bars). Among the major phylogenetic classes, the distributions are highly correlated (r2=0.81).
Figure 2
Figure 2
(a) Illustration of the method for determining character lengths (i.e. the number of strokes per character). Each character is decomposed into separable strokes, where strokes are separated by discontinuities so that ‘U’ is one stroke but ‘V’ is two, and also stroke junctions are decomposed into their constituents so that ‘T’ and ‘X’ junctions possess two strokes, ‘Y’, ‘K’ and ‘Ψ‘ junctions possess three strokes, etc. Three nave observers were asked to decompose characters into strokes, and there were no disagreements. (b) Plot of average character length versus the number of characters (on a log scale), for 115 writing systems. Data are labelled by abjad (characters for consonants but not vowels), abugidas (characters for consonants and diacritic symbols for vowels), alphabets (characters for consonants and vowels), syllabaries (characters for syllables such as ‘ba’, ‘be’, ‘bi’, etc.) and numerals (characters for numbers). x-axis values have been randomly perturbed by ±1% to help distinguish the points on the plot. The average length is 2.79 for invented systems (a set of 38 independent writing systems) and 2.70 for non-invented systems. Inset: plot of the same data, and same axes, but average character lengths binned at 0.1 intervals along the x-axis (standard error bars shown). One can see that, except for number systems where the average length is approximately 2 (the average across the average lengths of the 22 numeral systems is 1.95, with standard error 0.14), the average character length does not appear to vary as a function of writing system size (the average across the average lengths of the 93 non-numeral systems is 2.91, with standard error 0.09). These data mean that human writing systems conform to the invariant-length approach to accommodating writing systems of greater size.
Figure 3
Figure 3
(a) Illustration of how the stroke-type repertoire is determined for a writing system. After the characters are decomposed into their constituent strokes (see figure 1a), the strokes are clustered near strokes that appear to be similar. Stroke types were determined by the primary author (M.C.) on the basis of high intra-cluster similarity in orientation, shape and length. (b) As a test of repeatability, three nave observers (G.Z., H.Y. and A.H.) were asked to determine the stroke-type repertoire for a wide variety of writing systems (G.Z. and H.Y. carried this out for Ancient Berber, Ahom, Albanian, Arabic, Arabic numerals, Aramaic, Armenian, Asomtavruli, Avestan, Hanuno’o, Cherokee, Hungarian Runes, Elder Futhark, Danish Futhark, Kpelle; and A.H. carried this out for just the first six). On the left is a log–log plot of the average stroke-type repertoire size measured by the three nave observers versus the estimates of M.C. Standard error bars are shown, as well as the best-fit (by linear regression) equation and line, and the correlation. One can see that the correlation is high and that the exponent relating them is approximately 1, meaning that nave observers’ estimates of stroke-type repertoire size scale in direct proportion to the estimates of M.C. The three plots on the right possess the same x-axis as the one on the left, but the y-axis now has each individual observer’s stroke-type estimates. The effects of systematic under- or over-counting (as seen for example in G.Z.) will affect the proportionality constant relating stroke-type repertoire size, B, to writing system size, C, but not the scaling exponent, which is what is of interest to us here. (c) Plot of number of stroke types versus number of characters for 115 writing systems. Circles, abjad; plus symbols, abugida; minus symbols, alphabet; crosses, syllabary; and triangles, numerical. The linear regression line and equation are shown, along with correlation. Data points on each axis have been perturbed by ±1% to aid in their discrimination. The best-fit relationship is B=3.18C0.57 for invented systems (a set of independent data), and B=2.31C0.60 for non-invented systems. Inset: same plot, and same axes, but stroke-type repertoire sizes binned at 0.1 intervals along the log C-axis (standard error bars shown).
Figure 4
Figure 4
(a) Illustration of how a stroke-type network is built from the character repertoire and stroke type repertoire. Each stroke type is represented as a node in the network, and two stroke types are connected just in cases where those stroke types intersect in some character of the writing system; intuitively, stroke types sharing an edge in the network have the ability to ‘interact’. When a stroke does not intersect other strokes of a character—like the dot of an ‘i’—the stroke is deemed to intersect the physically nearest stroke. (b) Log–log plot of average stroke-type degree versus number of characters for 115 writing systems. Circles, abjad; plus symbols, abugida; minus symbols, alphabet; crosses, syllabary; and triangles, numerical. The linear regression line and equation are shown, along with correlation. x-axis values have been perturbed by ±1% to aid in their discrimination. The best-fit relationship is δ=1.40C0.22 for invented systems (a set of independent data), and δ=1.16C0.30 for non-invented systems. Inset: same plot, and same axes, but stroke-type degrees binned at 0.1 intervals along the log C-axis (standard error bars shown).

References

    1. Ager S. 1998. Omniglot: a guide to writing systems. See http://www.omniglot.com.
    1. Chakravarty I. A generalized line and junction labeling scheme with applications to scene analysis. IEEE Trans. Pattern Analysis Machine Intell. 1979;1:202–205. - PubMed
    1. Changizi M.A. Universal scaling laws for hierarchical complexity in languages, organisms, behaviors and other combinatorial systems. J. Theor. Biol. 2001;211:277–295. - PubMed
    1. Changizi M.A. The relationship between number of muscles, behavioral repertoire, and encephalization in mammals. J. Theor. Biol. 2003a;220:157–168. - PubMed
    1. Changizi M.A. Kluwer; Dordrecht, The Netherlands: 2003b. The brain from 25000 feet: high level explorations of brain complexity, perception, induction and vagueness.

Publication types

LinkOut - more resources