. 2005 Apr 15;564(Pt 2):329-45.
doi: 10.1113/jphysiol.2004.078840. Epub 2005 Feb 10.

Extracellular potassium effects are conserved within the rat erg K+ channel family

Affiliations

Extracellular potassium effects are conserved within the rat erg K+ channel family

Patrick Sturm et al. J Physiol. .

Abstract

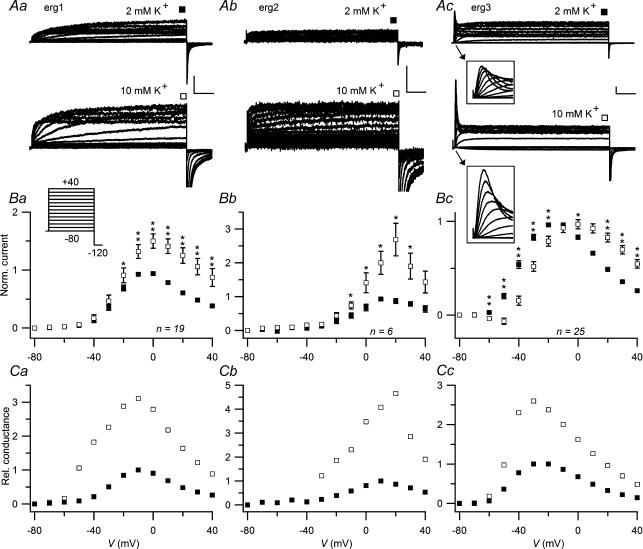
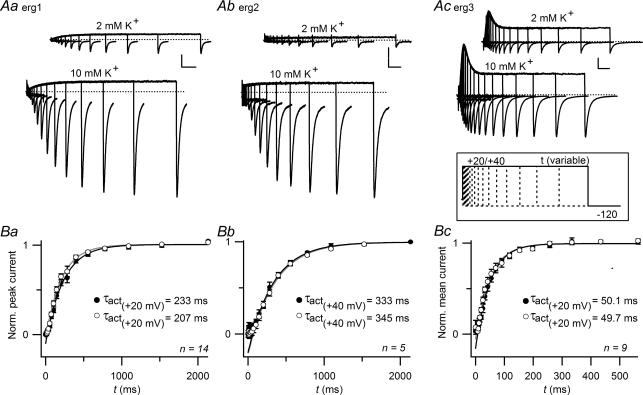
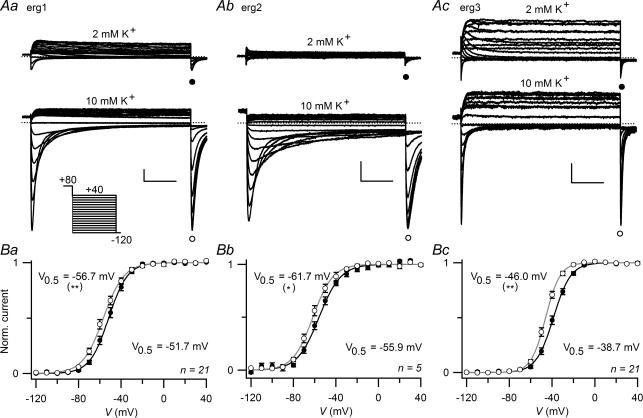
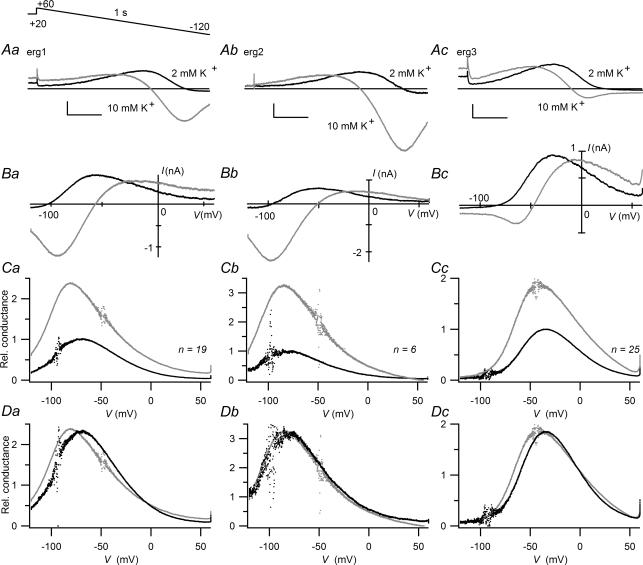
The biophysical properties of native cardiac erg1 and recombinant HERG1 channels have been shown to be influenced by the extracellular K(+) concentration ([K(+)](o)). The erg1 conductance, for example, increases dramatically with a rise in [K(+)](o). In the brain, where local [K(+)](o) can change considerably with the extent of physiological and pathophysiological neuronal activity, all three erg channel subunits are expressed. We have now investigated and compared the effects of an increase in [K(+)](o) from 2 to 10 mm on the three rat erg channels heterologously expressed in CHO cells. Upon increasing [K(+)](o), the voltage dependence of activation was shifted to more negative potentials for erg1 (DeltaV(0.5) = -4.0 +/- 1.1 mV, n = 28) and erg3 (DeltaV(0.5) = -8.4 +/- 1.2 mV, n = 25), and was almost unchanged for erg2 (DeltaV(0.5) = -2.0 +/- 1.3 mV, n = 6). For all three erg channels, activation kinetics were independent of [K(+)](o), but the slowing of inactivation by increased [K(+)](o) was even more pronounced for erg2 and erg3 than for erg1. In addition, with increased [K(+)](o), all three erg channels exhibited significantly slower time courses of recovery from inactivation and of deactivation. Whole-cell erg-mediated conductance was determined at the end of 4 s depolarizing pulses as well as with 1 s voltage ramps starting from the fully activated state. The rise in [K(+)](o) resulted in increased conductance values for all three erg channels which were more pronounced for erg2 (factor 3-4) than for erg1 (factor 2.5-3) and erg3 (factor 2-2.5). The data demonstrate that most [K(+)](o)-dependent changes in the biophysical properties are well conserved within the erg K(+) channel family, despite gradual differences in the magnitude of the effects.


Figures

Figure 1
Figure 1. Influence of [K+]o on erg1, erg2 and erg3 currents
Using a holding potential of −80 mV, erg current activation was measured with 4 s depolarizing pulses to potentials between −80 and +40 mV. A, comparison of erg1 (a), erg2 (b) and erg3 (c) currents recorded with 2 mm[K+]o and after a change to 10 mm[K+]o. Vertical and horizontal scale bars denote 200 pA and 500 ms, respectively. The insets in Ac show the first 100 ms on an expanded time scale. B, mean normalized current amplitudes at the end of the 4 s test pulses as a function of the test pulse potential for the three erg channels. For each experiment, current amplitudes were normalized with respect to the maximal outward current obtained in 2 mm[K+]o. C, relative conductance values, which were normalized to the maximal erg conductance obtained in 2 mm[K+]o, are plotted as a function of the test pulse potential. Absolute conductance values (G) were calculated according to the equation G = I/(VVrev) using the mean current amplitudes (I) shown in B and reversal potential values (Vrev) determined by voltage ramps (see Fig. 7). ▪, 2 mm[K+]o; □, 10 mm[K+]o. The number of experiments (n) is indicated; error bars denote s.e.m.*P≤ 0.05; **P≤ 0.01, significant differences with two-tailed paired t test.
Figure 2
Figure 2. A rise in [K+]o shifts the voltage dependence of erg1 and erg3 channel activation to more negative potentials
Data from the same set of experiments as shown in Fig. 1. The maximal current amplitudes at repolarization to −120 mV served as a measure of erg channel activation during the preceding 4 s depolarizing test pulse. A, representative examples of erg1 (a), erg2 (b) and erg3 (c) currents recorded in 2 mm and 10 mm[K+]o. Vertical and horizontal scale bars denote 500 pA and 20 ms. B, mean normalized maximal current amplitudes as a function of the preceding test pulse potential for the three erg channels in 2 mm and in 10 mm[K+]o solutions. Data points were fitted with a Boltzmann equation (continuous lines) yielding the indicated potentials of half-maximal activation (V0.5). Number of experiments (n) is indicated; error bars denote s.e.m.•, 2 mm[K+]o; ○: 10 mm[K+]o. **P≤ 0.01, significant difference with two-tailed paired t test as described in the text.
Figure 3
Figure 3. Activation kinetics of erg channels do not depend on [K+]o
A, erg1, erg2 and erg3 current traces evoked by depolarizing pulses to +20 mV (erg1 and erg3) or +40 mV (erg2) of increasing duration followed by a hyperpolarization to −120 mV. The holding potential was −80 mV. Vertical and horizontal scale bars denote 500 pA and 200 ms in Aa and Ab, and 500 pA and 50 ms in Ac. Peak amplitudes (Ba, Bb) or mean amplitudes (Bc) of erg currents elicited upon the hyperpolarizations were normalized, averaged and plotted against the duration of the preceding depolarization to 20 or 40 mV. After a delay, the erg current amplitudes could be well fitted with a single exponential function yielding the indicated time constants. Number of experiments (n) is indicated; note the different time scale for erg3. •, 2 mm[K+]o; ○, 10 mm[K+]o.
Figure 4
Figure 4. A rise in [K+]o slows the inactivation of erg channels
A, representative current traces evoked by test pulses to potentials between −80 and +60 mV following a 2 s depolarizing pulse to +20 mV with a subsequent 25 ms hyperpolarization to −100 mV (for erg1 and erg2) or −60 mV (for erg3) in cells expressing erg1, erg2 or erg3 channels. The holding potential was −20 mV. Vertical and horizontal scale bars denote 1 nA and 100 ms. B, mean time constants of inactivation (τinact) as a function of the test pulse potential for the three erg channels determined in 2 mm K+ and after a change to 10 mm K+ solution. C, voltage dependence of the ratio of the steady-state current to the maximal erg current at the onset of inactivation. *P≤ 0.05 and **P≤ 0.01, significant differences with two-tailed paired t test. The insets show the voltage dependence of the extrapolated instantaneous current (Imax) in the two different [K+]o concentrations. Filled symbols, 2 mm[K+]o; open symbols, 10 mm[K+]o.
Figure 5
Figure 5. Voltage dependence of erg current availability is slightly shifted by increased [K+]o
A, erg1 (a), erg2 (b) and erg3 (c) currents recorded with 2 mm or 10 mm[K+]o in the bath solution. The pulse protocol consisted of variable 1 s test pulses to potentials between 40 and −120 mV in steps of 10 mV from a holding potential of −20 mV. A 400 ms depolarization to 80 mV preceded the test pulses to fully activate the erg channels. The variable test pulses were followed by a hyperpolarization to −120 mV. Vertical and horizontal scale bars denote 500 pA and 200 ms. B, the normalized maximal erg current amplitudes at the hyperpolarizing pulse to −120 mV were averaged and plotted versus the preceding test pulse potential. •, 2 mm[K+]o; ○, 10 mm[K+]o. Data points were fitted with a Boltzmann equation (continuous lines) yielding the indicated potentials of half-maximal erg current (V0.5). Number of experiments (n) is indicated. *P≤ 0.05 and **P≤ 0.01, significant differences with two-tailed paired t test as described in the text.
Figure 6
Figure 6. An increase in [K+]o slows recovery from inactivation and deactivation kinetics of erg1, erg2 and erg3 channels
Time constants of recovery from inactivation (τrec) and fast (τfast) and slow (τslow) deactivation for erg1 (a), erg2 (b) and erg3 (c) currents determined from experiments as shown in Fig. 5. τrec (A), τfast (B) and τslow (C) as functions of the hyperpolarizing test pulse potential determined for the three erg channels in 2 mm[K+]o (filled symbols) and 10 mm[K+]o (open symbols). The number of evaluated current traces varied, mainly due to the small current amplitudes close to the reversal potentials. *P≤ 0.05 and **P≤ 0.01, significant differences with two-tailed unpaired t test.
Figure 7
Figure 7. A rise in [K+]o increases erg1, erg2 and erg3 whole-cell conductance
Erg currents were elicited by a 1 s voltage ramp from 60 to −120 mV starting from the fully activated state using a holding potential of −20 mV and a 2 s prepulse to +20 mV. A, superimposition of erg1 (a), erg2 (b) and erg3 currents (c) recorded with the voltage ramp protocol in 2 mm[K+]o and after a change to 10 mm[K+]o. Vertical and horizontal scale bars denote 500 pA and 200 ms. B, erg current amplitudes as a function of the ramp voltage. Same experiments as shown in A. C, the erg whole-cell conductance was calculated using mean ramp current values which were corrected for unspecific currents measured in control CHO cells and the resulting corrected reversal potentials (Vrev in 2 mm[K+]o: −93.4, −97.5 and −92.5 mV; Vrev in 10 mm[K+]o: −49.0, −49.0 and −45.0 mV for erg1, erg2 and erg3, respectively). Conductance values were normalized with respect to the maximal mean conductance obtained in 2 mm[K+]o and plotted versus the ramp voltage. D, superimposed mean conductance curves as shown in C, with the data obtained with 2 mm[K+]o scaled to the maximal amplitude obtained with 10 mm[K+]o. Black lines or dots, 2 mm[K+]o; grey lines or dots, 10 mm[K+]o. The number of experiments (n) is indicated.
Figure 8
Figure 8. Erg1 and erg3 currents elicited with spike train protocols in 2 and 10 mM [K+]o
Averages of erg1 (A,n = 7) and erg3 (B,n = 29) current traces obtained in 2 mm and 10 mm[K+]o after subtraction of unspecific currents. Membrane currents were elicited from a holding potential of −60 mV using the pulse protocol shown at the top which consisted of 20 5-ms voltage ramps from +30 to −30 mV following 1 ms pulses to +30 mV, thus simulating a burst of action potentials with a frequency of 38.5 Hz. On the right of the current traces, mean erg current amplitudes during the subsequent ramp pulses are shown as a function of the ramp voltage.

References

    1. Anantharam A, Lewis A, Panaghie G, Gordon E, McCrossan ZA, Lerner DJ, Abbott GW. RNA interference reveals that endogenous Xenopus MinK-related peptides govern mammalian K+ channel function in oocyte expression studies. J Biol Chem. 2003;278:11739–11745. 10.1074/jbc.M212751200. - DOI - PubMed
    1. Aydar E, Palmer C. Functional characterization of the C-terminus of the human ether-à-go-go-related gene K+ channel (HERG) J Physiol. 2001;534:1–14. 10.1111/j.1469-7793.2001.t01-3-00001.x. - DOI - PMC - PubMed
    1. Barros F, del Camino D, Pardo LA, Palomero T, Giraldez T, de la Pena P. Demonstration of an inwardly rectifying K+ current component modulated by thyrotropin-releasing hormone and caffeine in GH3 rat anterior pituitary cells. Pflugers Arch. 1997;435:119–129. 10.1007/s004240050491. - DOI - PubMed
    1. Bauer CK. The erg inwardly rectifying K+ current and its modulation by thyrotrophin-releasing hormone in giant clonal rat anterior pituitary cells. J Physiol. 1998;510:63–70. - PMC - PubMed
    1. Bauer CK, Engeland B, Wulfsen I, Ludwig J, Pongs O, Schwarz JR. RERG is a molecular correlate of the inward-rectifying K current in clonal rat pituitary cells. Receptors Channels. 1998;6:19–29. - PubMed

Publication types

LinkOut - more resources