

Global mapping of the protein structure space and application in structure-based inference of protein function
- PMID: 15705717
- PMCID: PMC548596
- DOI: 10.1073/pnas.0409772102
Global mapping of the protein structure space and application in structure-based inference of protein function
Abstract
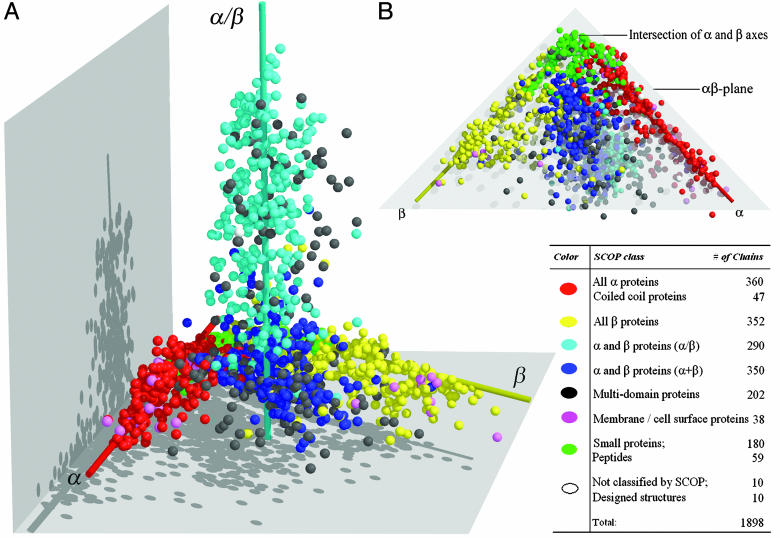
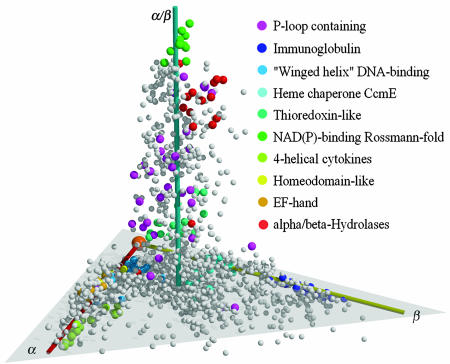
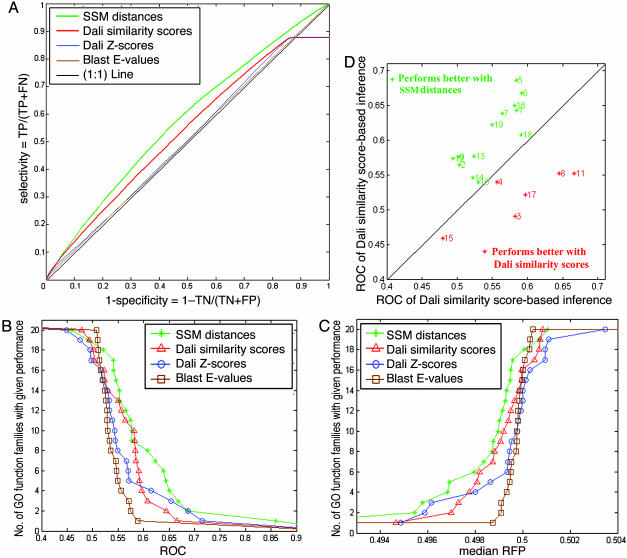
We have constructed a map of the "protein structure space" by using the pairwise structural similarity scores calculated for all nonredundant protein structures determined experimentally. As expected, proteins with similar structures clustered together in the map and the overall distribution of structural classes of this map followed closely that of the map of the "protein fold space" we have reported previously. Consequently, proteins sharing similar molecular functions also were found to colocalize in the protein structure space map, pointing toward a previously undescribed scheme for structure-based functional inference for remote homologues based on the proximity in the map of the protein structure space. We found that this scheme consistently outperformed other predictions made by using either the raw scores or normalized Z-scores of pairwise DALI structure alignment.
Figures
Comment in
-
A glimpse at the organization of the protein universe.Proc Natl Acad Sci U S A. 2005 Apr 19;102(16):5641-2. doi: 10.1073/pnas.0500274102. Epub 2005 Apr 12. Proc Natl Acad Sci U S A. 2005. PMID: 15827120 Free PMC article. No abstract available.
Similar articles
-
Automatic classification of protein structures using low-dimensional structure space mappings.BMC Bioinformatics. 2014;15 Suppl 2(Suppl 2):S1. doi: 10.1186/1471-2105-15-S2-S1. Epub 2014 Jan 24. BMC Bioinformatics. 2014. PMID: 24564500 Free PMC article.
-
Assessing annotation transfer for genomics: quantifying the relations between protein sequence, structure and function through traditional and probabilistic scores.J Mol Biol. 2000 Mar 17;297(1):233-49. doi: 10.1006/jmbi.2000.3550. J Mol Biol. 2000. PMID: 10704319
-
Touring protein fold space with Dali/FSSP.Nucleic Acids Res. 1998 Jan 1;26(1):316-9. doi: 10.1093/nar/26.1.316. Nucleic Acids Res. 1998. PMID: 9399863 Free PMC article.
-
Sequence and structure alignments in post-AlphaFold era.Curr Opin Struct Biol. 2023 Apr;79:102539. doi: 10.1016/j.sbi.2023.102539. Epub 2023 Feb 6. Curr Opin Struct Biol. 2023. PMID: 36753924 Review.
-
Structure-based inference of molecular functions of proteins of unknown function from Berkeley Structural Genomics Center.J Struct Funct Genomics. 2007 Sep;8(2-3):99-105. doi: 10.1007/s10969-007-9025-4. Epub 2007 Sep 2. J Struct Funct Genomics. 2007. PMID: 17764033 Review.
Cited by
-
Global organization of a binding site network gives insight into evolution and structure-function relationships of proteins.Sci Rep. 2017 Sep 14;7(1):11652. doi: 10.1038/s41598-017-10412-z. Sci Rep. 2017. PMID: 28912495 Free PMC article.
-
Exploring protein dynamics space: the dynasome as the missing link between protein structure and function.PLoS One. 2012;7(5):e33931. doi: 10.1371/journal.pone.0033931. Epub 2012 May 11. PLoS One. 2012. PMID: 22606222 Free PMC article.
-
Structural Outlier Detection and Zernike-Canterakis Moments for Molecular Surface Meshes-Fast Implementation in Python.Molecules. 2023 Dec 21;29(1):52. doi: 10.3390/molecules29010052. Molecules. 2023. PMID: 38202635 Free PMC article.
-
Expanding the space of protein geometries by computational design of de novo fold families.Science. 2020 Aug 28;369(6507):1132-1136. doi: 10.1126/science.abc0881. Science. 2020. PMID: 32855341 Free PMC article.
-
The impact of structural diversity and parameterization on maps of the protein universe.BMC Proc. 2013 Dec 20;7(Suppl 7):S1. doi: 10.1186/1753-6561-7-S7-S1. Epub 2013 Dec 20. BMC Proc. 2013. PMID: 24565442 Free PMC article.
References
-
- Bucher, P. & Bairoch, A. (1994) Proceedings of the Second International Conference on Intelligent Systems for Molecular Biology, eds. Altman, R., Brutlag, D., Karp, P., Lathrop, R. & Searls, D. (AAAI Press, Menlo Park, CA), pp. 53-61.
-
- Sonnhammer, E. L., Eddy, S. R. & Durbin, R. (1997) Proteins 28, 405-420. - PubMed
Publication types
MeSH terms
Substances
Grants and funding
LinkOut - more resources
Full Text Sources
Research Materials
