

Endothelial apoptosis induced by inhibition of integrins alphavbeta3 and alphavbeta5 involves ceramide metabolic pathways
- PMID: 15705795
- PMCID: PMC1895032
- DOI: 10.1182/blood-2004-08-3098
Endothelial apoptosis induced by inhibition of integrins alphavbeta3 and alphavbeta5 involves ceramide metabolic pathways
Abstract
Matrix ligation of integrins alphavbeta3/alphavbeta5 is critical for endothelial survival and angiogenesis. We have previously shown that ceramide, a proapoptotic lipid second messenger, increases during endothelial anoikis (detachment-induced apoptosis). We now show that RGDfV, an integrin alphavbeta3/alphavbeta5 cyclic function-blocking peptide, increased ceramide and decreased sphingomyelin in human brain microvascular endothelial cells (HBMECs) plated on vitronectin, suggesting that sphingomyelin hydrolysis contributes to RGDfV-induced ceramide increase. Desipramine and imipramine, inhibitors of acid sphingomyelinase (ASMase), suppressed RGDfV-induced ceramide increase. Importantly, desipramine, imipramine, and a third ASMase inhibitor, SR33557, but not inhibitors of neutral sphingomyelinase, suppressed RGDfV-induced apoptosis, suggesting that ASMase was required for integrin-mediated apoptosis. Myriocin, an inhibitor of de novo ceramide synthesis, had no effect on RGDfV-induced HBMEC apoptosis. Interestingly, ASMase inhibitors also suppressed the RGDfV-induced loss of spreading on vitronectin. RGDfV induced a similar increase in ceramide and apoptosis in HBMECs on poly-l-lysine or vitronectin, although cells detached only from vitronectin, indicating that cell detachment was not required for RGDfV-induced apoptosis. Our results suggest involvement of ASMase and ceramide in endothelial apoptosis induced by inhibition of integrins alphavbeta3/alphavbeta5, and propose a novel molecular mechanism for the antiangiogenic effect of RGDfV.
Figures
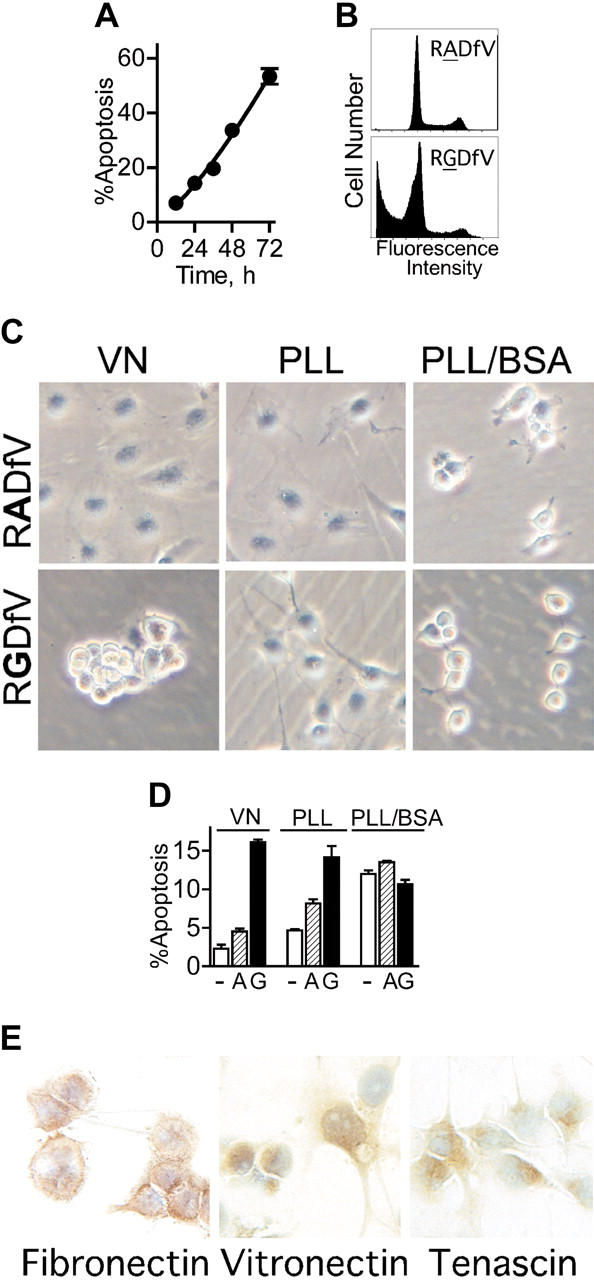
 ), or RGDfV (G; ▪; 25 μg/mL) for 24 hours. Apoptosis was assessed as in panels A-B, in triplicate samples for each condition. P < .001 between vehicle control– or RADfV-treated cells and the RGDfV-treated cells on vitronectin or on unblocked PLL. The difference was not significant on PLL/BSA (unpaired t tests, n = 3). (E) HBMECs (3 × 10⁵ cells/well in 2-well chamber slides) were seeded and cultured for 30 hours without serum. Slides were fixed and stained for vitronectin, fibronectin, and tenascin as described in “Materials and methods.” Control slides that were stained with rabbit or mouse immunoglobulin G (IgG), but not the primary antibodies, showed only the blue nuclear counterstain (data not shown). Photographs were taken using an Olympus DP10 digital camera, on an Olympus BX40 microscope. Original magnification, × 400.
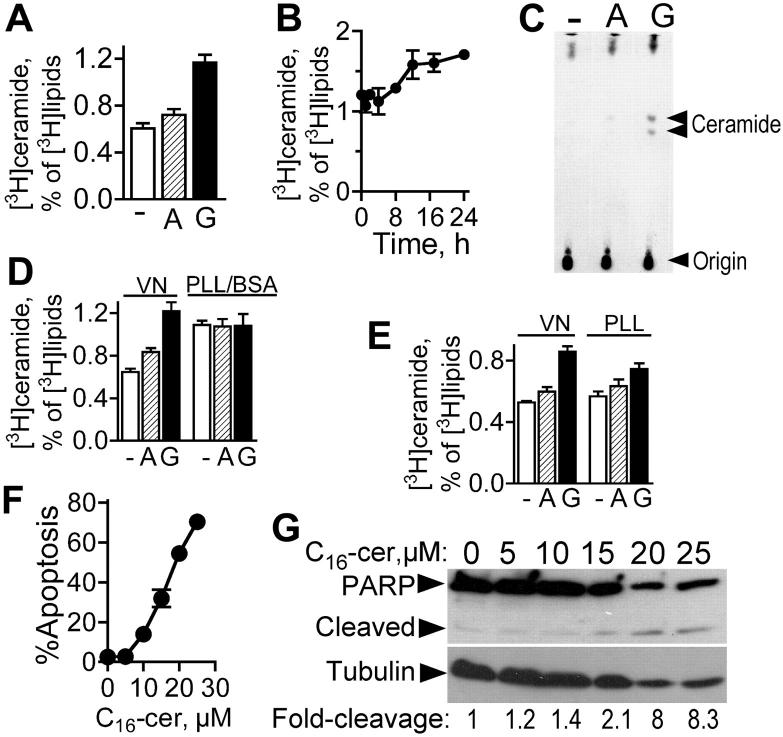 ; 25 μg/mL), or vehicle control (□, DMSO) was added 2 hours after plating. Cells were labeled with [3H]palmitic acid at the time of addition of peptides. Following overnight incubation, cells were collected, lipids extracted, and [3H]ceramide was assessed by TLC as described in “Materials and methods.” Results are depicted as percent [3H]ceramide of total [3H]lipids extracted. Bars are means of 27 (vehicle), 31 (RADfV), or 33 (RGDfV) repeat experiments, each performed in triplicate. P < .001 between vehicle and RGDfV and between RADfV and RGDfV, but P = .085 between vehicle and the control peptide, RADfV. (B) Experiment was performed as in panel A; cells were collected at different time points; P = .004 by one-way ANOVA; n = 3. (C) Cells were labeled and treated, and lipids were extracted and resolved on TLC as in panel A. The TLC plate was exposed to film for 7 days. (D-E) HBMECs (106 cells/10-cm dish) were allowed to adhere for 2 hours to plates coated with BSA-blocked vitronectin (D-E); PLL that was blocked with 1% BSA (D); or PLL that was left unblocked (E). Cells were labeled with [3H]palmitic acid and treated with RGDfV (G; ▪) or RADfV (A; ; 25 μg/mL), or vehicle control (-; □). Ceramide was determined as in panel A. In panel D, P values on VN were vehicle versus RGDfV (P = .003) and RADfV versus RGDfV (P = .014). In vehicle control–treated cells on VN versus on PLL/BSA, P = .001, and RADfV on VN versus vehicle-control cells on PLL/BSA had P = .010. However, P value was not significant (P > .17 to .37) for all comparisons between RGDfV-treated cells on VN and any of the treatment conditions on PLL/BSA. In panel E, P values were as follows: VN versus PLL (vehicle controls, □), P = .291; vehicle versus RGDfV on VN, P = .001; RADfV versus RGDfV on VN, P = .001; and vehicle versus RGDfV on PLL, P = .021. P value for RGDfV-treated cells on VN versus PLL was not significant (P = .087). (F) HBMECs (106 per 10-cm plate) were incubated for 24 hours with C16-ceramide that was prepared as described in “Materials and methods.” They were then harvested, fixed, permeabilized, stained with propidium iodide, and analyzed by flow cytometry for the sub G0/G1 fraction. P < .001 by one-way ANOVA; n = 3. (G) Lysates from 0.3 × 10⁶ control or ceramide-treated HBMECs incubated as in panel E were resolved by SDS-PAGE. PARP cleavage was assessed by Western blotting. Tubulin blot was used as loading control. Fold cleavage compared with control cells was calculated from the digitized images and corrected for tubulin.
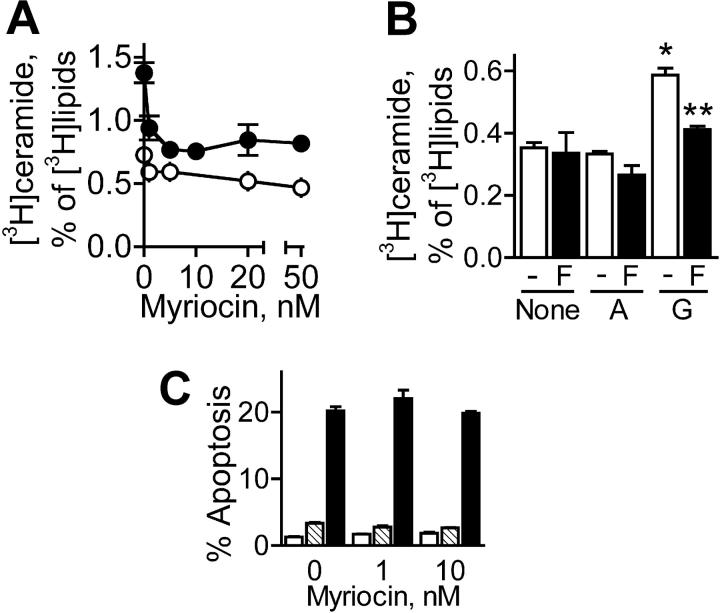
 ; 25 μg/mL), or vehicle control (□). Cells were collected 24 hours later and apoptosis was assessed by PI staining. n = 3.
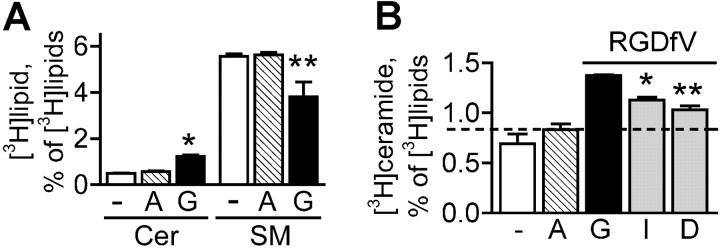 ), or vehicle control (-; □) for 24 hours. Lipids were extracted, and [3H]ceramide and [3H]sphingomyelin of each sample were determined by TLC as described in “Materials and methods.” *P < .001 ([3H]ceramide) and **P = .029 ([3H]sphingomyelin) compared with the corresponding RADfV or vehicle control, by unpaired t test; n = 3, representative experiment of 5 experiments, each performed in triplicate. (B) HBMECs were seeded on vitronectin, labeled with [3H]palmitic acid, and exposed to RGDfV (G, ▪), RADfV (A, ), or vehicle control (-, □), as described in panel A. The 2 RGDfV-treated triplicate samples were also incubated with imipramine (I) or desipramine (D) (20 μM;
  ) starting 2 hours prior to addition of RGDfV. [3H]ceramide was assessed after overnight incubation as in panel A. *P = .001 and **P = .001 compared with RGDfV. The dashed line depicts the level of baseline cellular ceramide content in HBMECs treated with the RADfV control peptide.
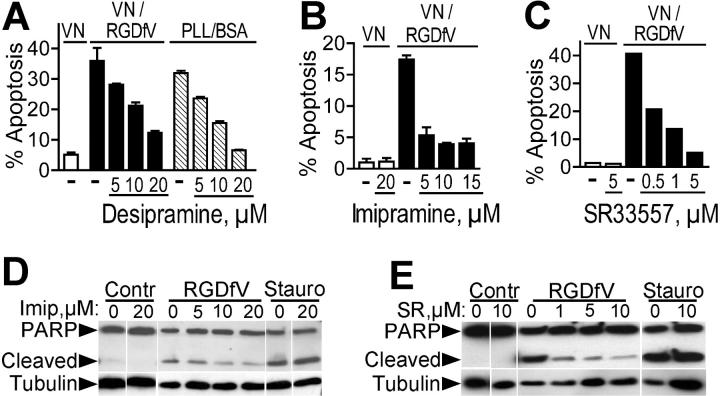 ). They were then incubated with RGDfV (▪) or vehicle control (□ or ). Cells were collected 24 hours later and apoptosis was assessed by PI staining. Desipramine (5-20 μM) was added where indicated starting 2 hours prior to the addition of RGDfV or prior to plating on PLL/BSA. P = .001 for increasing doses of desipramine on vitronectin with RGDfV, and P < .001 for desipramine on PLL/BSA, by one-way ANOVA (n = 3). (B) Cells were plated on vitronectin/BSA and treated and analyzed as in panel A, except that the inhibitor was imipramine. P < .001 by one-way ANOVA in respect to increasing doses of imipramine; n = 3. (C) Cells were plated on vitronectin, treated with RGDfV as indicated, and analyzed as in panels A-B, except that the inhibitor was SR33557. (D-E) Cells were plated on vitronectin and treated with RGDfV or vehicle as in panels A-C. Imipramine (Imip; 5-20 μM) or SR33557 (SR; 1-10 μM) was added where indicated, starting 2 hours prior to RGDfV or vehicle. Staurosporine (50 nM) was used as a positive control. Cells were collected after 24 hours, cell lysates were resolved on 10% SDS-PAGE, and apoptosis was detected by PARP cleavage. Tubulin was used as loading control.
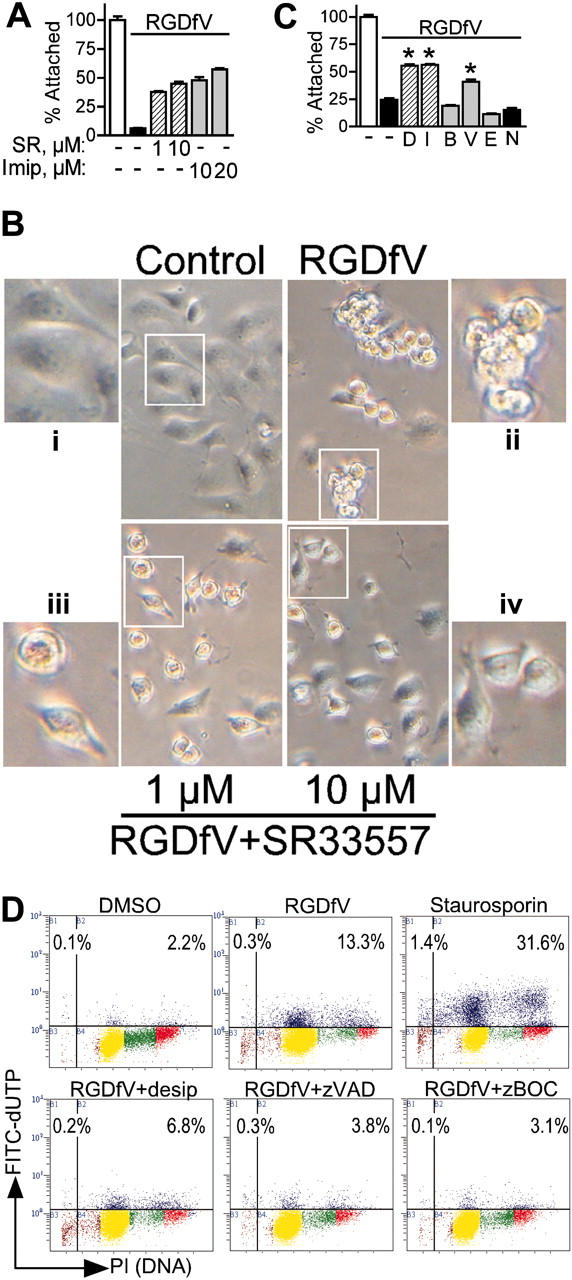 ), imipramine (), or vehicle control (▪) was added 2 hours after plating, followed 2 hours later with RGDfV (25 mg/mL) for an additional 18 hours. Detached cells were washed off and remaining cells were detected by MTT. Optical density was normalized compared with cells treated with vehicle control (□, 100%). P < .001 for RGDfV with SR33557 or imipramine compared with RGDfV alone, by unpaired t tests; n = 8 for each condition. (B) HBMECs (2 × 10⁵ cells/well) were allowed to adhere and spread for 2 hours in 6-well plate coated with vitronectin and blocked with BSA. SR33557 (1 or 10 μM; iii-iv) or vehicle (i-ii) was added, followed 2 hours later by RGDfV (25 μg/mL; ii-iv) or vehicle (i). Cells were photographed 18 hours later, as in Figure 1C. Insets depict enlargement of white rectangle in the adjacent figure. Original magnification, × 400. (C) HBMECs (4 × 10⁴ cells/well) were allowed to adhere and spread on plates coated with 10 μM vitronectin and blocked with BSA. After 2 hours, desipramine (D; 10 μM, ), imipramine (I; 10 μM, ), Z-VAD-FMK (V; 25 μM, ), BOC-D-FMK (B; 25 μM, ), Z-DEVD-FMK (E; 100 μM, ), or control caspase inhibitor (N, ▪), or vehicle control (-; ▪), was added to the medium, followed 2 hours later with RGDfV (25 mg/mL, indicated by horizontal bar) or vehicle (DMSO, □) for an additional 18 hours. Detached cells were then washed off and remaining cells were detected by MTT. Optical density was normalized compared with cells treated with vehicle control (clear bar, 100%). * denotes P < .001 (for RGDfV with desipramine, imipramine, or Z-VAD-FMK, compared with vehicle, by unpaired t tests [*]; n = 6-8 for each condition). (D) HBMECs (106 cells/10-cm dish) were allowed to spread on VN blocked with BSA. Then, 2 hours later, desipramine (10 μM) or the pan-caspase inhibitors Z-VAD-FMK or BOC-D-FMK (25 μM) was added. Following another 2 hours, RGDfV (25 μg/mL) or vehicle control (DMSO) was added for additional 18 hours. Cells treated with staurosporin (500 nM) served as positive control. Apoptosis was assessed by flow cytometry using the Apo-Direct kit. Percent values on the figure indicate percentage of cells with DNA damage in the 2 top quadrants (blue). FITC-dUTP indicates fluorescein isothiocyanate–deoxyuridine triphosphate.
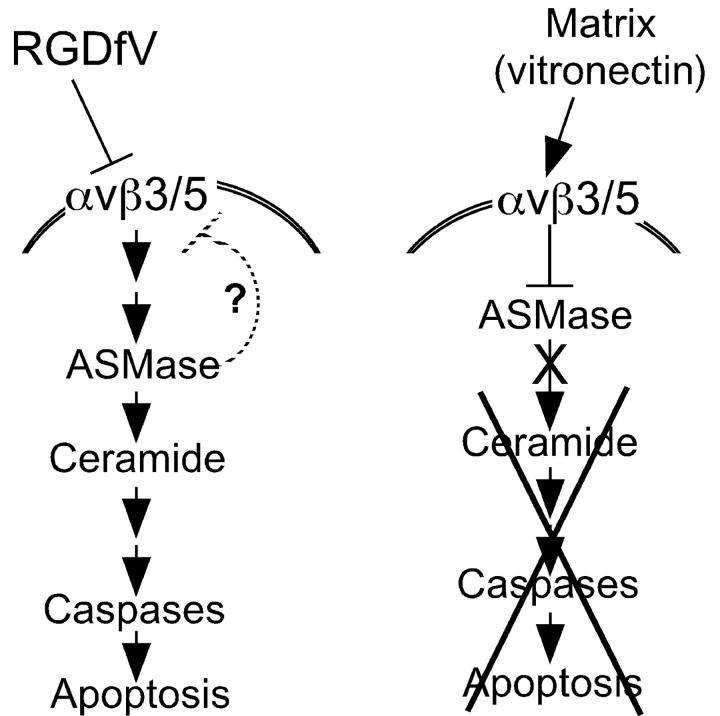
Similar articles
-
c-Abl is an upstream regulator of acid sphingomyelinase in apoptosis induced by inhibition of integrins αvβ3 and αvβ5.PLoS One. 2012;7(8):e42291. doi: 10.1371/journal.pone.0042291. Epub 2012 Aug 3. PLoS One. 2012. PMID: 22879933 Free PMC article.
-
Integrins alpha(v)beta3 and alpha(v)beta5 are expressed by endothelium of high-risk neuroblastoma and their inhibition is associated with increased endogenous ceramide.Cancer Res. 2000 Feb 1;60(3):712-21. Cancer Res. 2000. PMID: 10676658
-
c-Abl mediates endothelial apoptosis induced by inhibition of integrins alphavbeta3 and alphavbeta5 and by disruption of actin.Blood. 2010 Apr 1;115(13):2709-18. doi: 10.1182/blood-2009-05-223776. Epub 2010 Feb 2. Blood. 2010. PMID: 20124512 Free PMC article.
-
alphav Vitronectin receptors in vascular-mediated disorders.Med Res Rev. 2003 Mar;23(2):190-9. doi: 10.1002/med.10031. Med Res Rev. 2003. PMID: 12500288 Review.
-
Small molecule integrin antagonists in cancer therapy.Mini Rev Med Chem. 2009 Oct;9(12):1439-46. doi: 10.2174/138955709789957404. Mini Rev Med Chem. 2009. PMID: 19929817 Review.
Cited by
-
Ethanolic extract Ocimum sanctum Linn. induces an apoptosis in human lung adenocarcinoma (A549) cells.Heliyon. 2019 Nov 14;5(11):e02772. doi: 10.1016/j.heliyon.2019.e02772. eCollection 2019 Nov. Heliyon. 2019. PMID: 31844708 Free PMC article.
-
Acid sphingomyelinase deficiency protects mitochondria and improves function recovery after brain injury.J Lipid Res. 2019 Mar;60(3):609-623. doi: 10.1194/jlr.M091132. Epub 2019 Jan 20. J Lipid Res. 2019. PMID: 30662008 Free PMC article.
-
Roles and regulation of secretory and lysosomal acid sphingomyelinase.Cell Signal. 2009 Jun;21(6):836-46. doi: 10.1016/j.cellsig.2009.01.026. Cell Signal. 2009. PMID: 19385042 Free PMC article. Review.
-
Induction of membrane ceramides: a novel strategy to interfere with T lymphocyte cytoskeletal reorganisation in viral immunosuppression.PLoS Pathog. 2009 Oct;5(10):e1000623. doi: 10.1371/journal.ppat.1000623. Epub 2009 Oct 16. PLoS Pathog. 2009. PMID: 19834551 Free PMC article.
-
Fas-mediated apoptosis is regulated by the extracellular matrix protein CCN1 (CYR61) in vitro and in vivo.Mol Cell Biol. 2009 Jun;29(12):3266-79. doi: 10.1128/MCB.00064-09. Epub 2009 Apr 13. Mol Cell Biol. 2009. PMID: 19364818 Free PMC article.
References
-
- Hynes RO. Integrins: versatility, modulation, and signaling in cell adhesion. Cell. 1992;69: 11-25. - PubMed
-
- Giancotti FG, Ruoslahti E. Integrin signaling. Science. 1999;285: 1028-1032. - PubMed
-
- Martin KH, Slack JK, Boerner SA, Martin CC, Parsons JT. Integrin connections map: to infinity and beyond. Science. 2002;296: 1652-1653. - PubMed
-
- Shattil SJ, Newman PJ. Integrins: dynamic scaffolds for adhesion and signaling in platelets. Blood. 2004;104: 1606-1615. - PubMed
-
- Brooks PC, Clark RA, Cheresh DA. Requirement of vascular integrin αvβ3 for angiogenesis. Science. 1994;264: 569-571. - PubMed
Publication types
MeSH terms
Substances
Grants and funding
LinkOut - more resources
Full Text Sources
