

Active chromatin domains are defined by acetylation islands revealed by genome-wide mapping
- PMID: 15706033
- PMCID: PMC551575
- DOI: 10.1101/gad.1272505
Active chromatin domains are defined by acetylation islands revealed by genome-wide mapping
Abstract
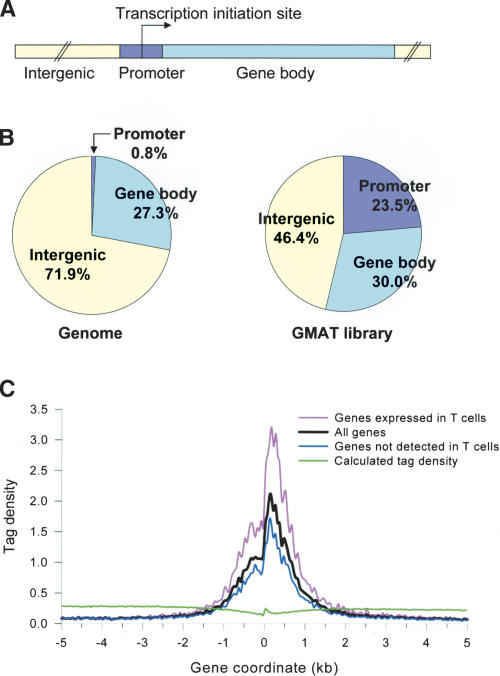
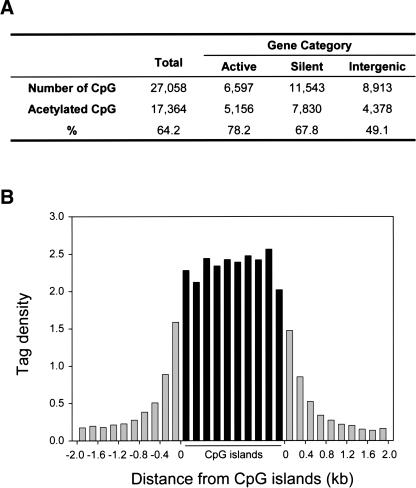
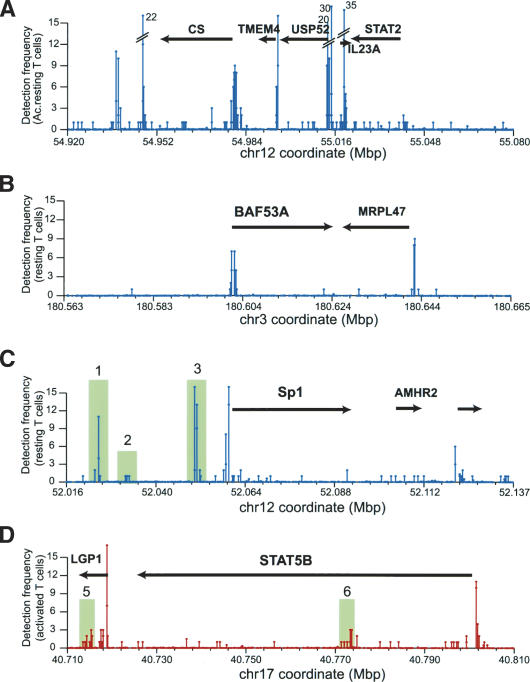
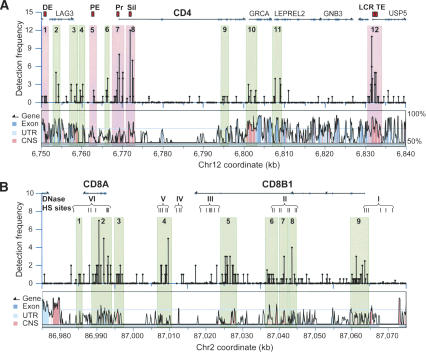
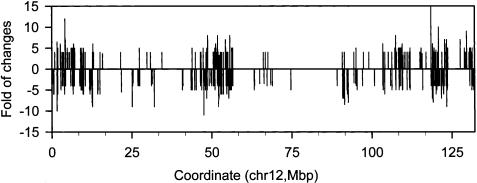
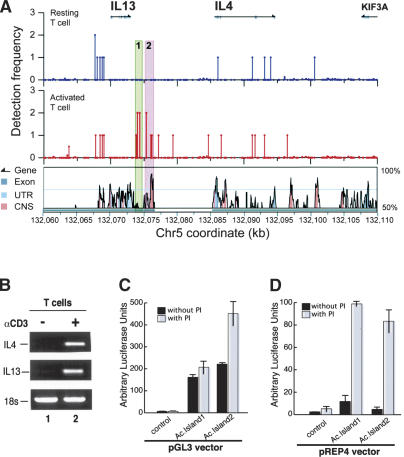
The identity and developmental potential of a human cell is specified by its epigenome that is largely defined by patterns of chromatin modifications including histone acetylation. Here we report high-resolution genome-wide mapping of diacetylation of histone H3 at Lys 9 and Lys 14 in resting and activated human T cells by genome-wide mapping technique (GMAT). Our data show that high levels of the H3 acetylation are detected in gene-rich regions. The chromatin accessibility and gene expression of a genetic domain is correlated with hyperacetylation of promoters and other regulatory elements but not with generally elevated acetylation of the entire domain. Islands of acetylation are identified in the intergenic and transcribed regions. The locations of the 46,813 acetylation islands identified in this study are significantly correlated with conserved noncoding sequences (CNSs) and many of them are colocalized with known regulatory elements in T cells. TCR signaling induces 4045 new acetylation loci that may mediate the global chromatin remodeling and gene activation. We propose that the acetylation islands are epigenetic marks that allow prediction of functional regulatory elements.
Figures
Similar articles
-
The genomic landscape of histone modifications in human T cells.Proc Natl Acad Sci U S A. 2006 Oct 24;103(43):15782-7. doi: 10.1073/pnas.0607617103. Epub 2006 Oct 16. Proc Natl Acad Sci U S A. 2006. PMID: 17043231 Free PMC article.
-
Epigenetic regulation of CIITA expression in human T-cells.Biochem Pharmacol. 2011 Nov 15;82(10):1430-7. doi: 10.1016/j.bcp.2011.05.026. Epub 2011 Jun 2. Biochem Pharmacol. 2011. PMID: 21664896
-
Genome-wide prediction of conserved and nonconserved enhancers by histone acetylation patterns.Genome Res. 2007 Jan;17(1):74-81. doi: 10.1101/gr.5767907. Epub 2006 Nov 29. Genome Res. 2007. PMID: 17135569 Free PMC article.
-
The mammalian epigenome.Cell. 2007 Feb 23;128(4):669-81. doi: 10.1016/j.cell.2007.01.033. Cell. 2007. PMID: 17320505 Review.
-
Histone acetylation and chromatin signature in stem cell identity and cancer.Mutat Res. 2008 Jan 1;637(1-2):1-15. doi: 10.1016/j.mrfmmm.2007.07.012. Epub 2007 Aug 1. Mutat Res. 2008. PMID: 17850830 Review.
Cited by
-
An unmethylated 3' promoter-proximal region is required for efficient transcription initiation.PLoS Genet. 2007 Feb 16;3(2):e27. doi: 10.1371/journal.pgen.0030027. Epub 2007 Jan 2. PLoS Genet. 2007. PMID: 17305432 Free PMC article.
-
The genomic landscape of histone modifications in human T cells.Proc Natl Acad Sci U S A. 2006 Oct 24;103(43):15782-7. doi: 10.1073/pnas.0607617103. Epub 2006 Oct 16. Proc Natl Acad Sci U S A. 2006. PMID: 17043231 Free PMC article.
-
Interleukin-21 receptor gene induction in human T cells is mediated by T-cell receptor-induced Sp1 activity.Mol Cell Biol. 2005 Nov;25(22):9741-52. doi: 10.1128/MCB.25.22.9741-9752.2005. Mol Cell Biol. 2005. PMID: 16260592 Free PMC article.
-
Transcription-coupled deposition of histone modifications during MHC class II gene activation.Nucleic Acids Res. 2007;35(10):3431-41. doi: 10.1093/nar/gkm214. Epub 2007 May 3. Nucleic Acids Res. 2007. PMID: 17478518 Free PMC article.
-
The histone-like NF-Y is a bifunctional transcription factor.Mol Cell Biol. 2008 Mar;28(6):2047-58. doi: 10.1128/MCB.01861-07. Epub 2008 Jan 22. Mol Cell Biol. 2008. PMID: 18212061 Free PMC article.
References
-
- Abbas A.K., Murphy, K.M., and Sher, A. 1996. Functional diversity of helper T lymphocytes. Nature 383: 787-793. - PubMed
-
- Agalioti T., Chen, G., and Thanos, D. 2002. Deciphering the transcriptional histone acetylation code for a human gene. Cell 111: 381-392. - PubMed
-
- Baltimore D. 2001. Our genome unveiled. Nature 409: 814-816. - PubMed
-
- Belotserkovskaya R., Oh, S., Bondarenko, V.A., Orphanides, G., Studitsky, V.M., and Reinberg, D. 2003. FACT facilitates transcription-dependent nucleosome alteration. Science 301: 1090-1093. - PubMed
-
- Berger S.L. 2002. Histone modifications in transcriptional regulation. Curr. Opin. Gen. Dev. 12: 142-148. - PubMed
Publication types
MeSH terms
Substances
LinkOut - more resources
Full Text Sources
Other Literature Sources
Molecular Biology Databases