. 2005 Mar 1;19(5):553-69.
doi: 10.1101/gad.1281105. Epub 2005 Feb 10.

An initial blueprint for myogenic differentiation

Affiliations

An initial blueprint for myogenic differentiation

Alexandre Blais et al. Genes Dev. .

Abstract

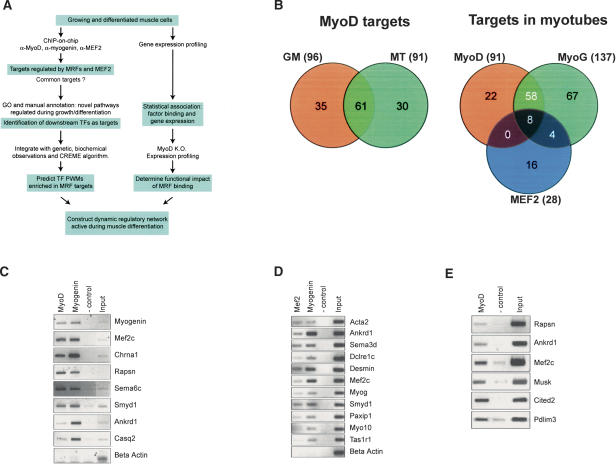
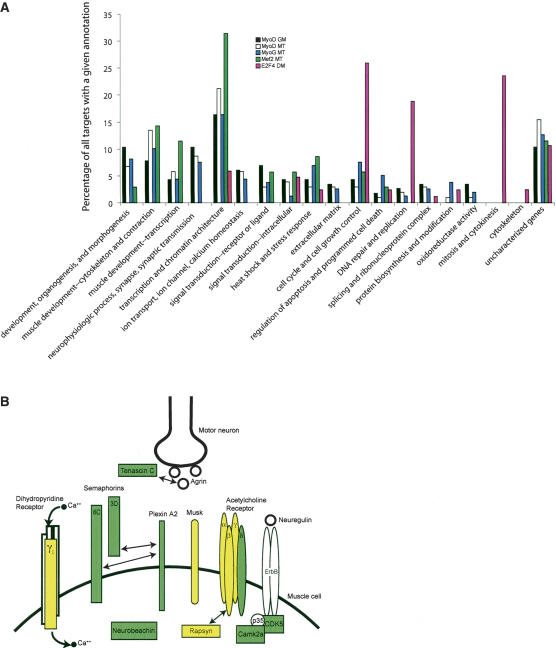
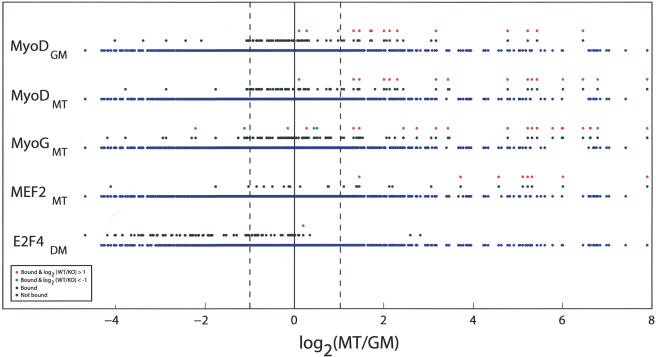
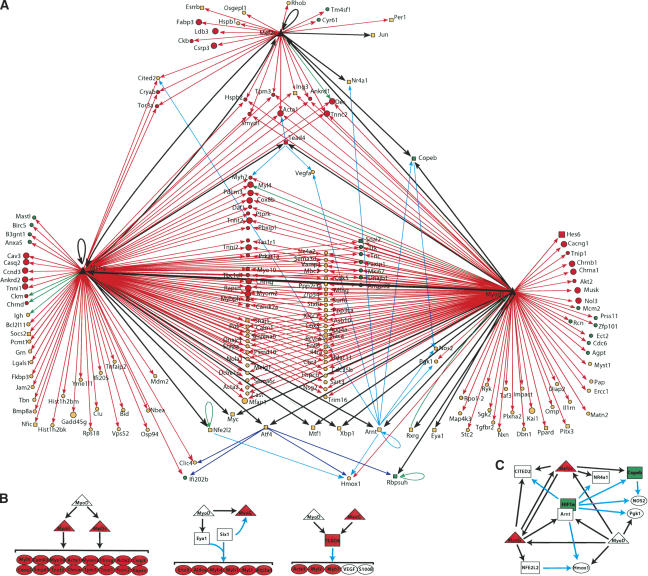
We have combined genome-wide transcription factor binding and expression profiling to assemble a regulatory network controlling the myogenic differentiation program in mammalian cells. We identified a cadre of overlapping and distinct targets of the key myogenic regulatory factors (MRFs)--MyoD and myogenin--and Myocyte Enhancer Factor 2 (MEF2). We discovered that MRFs and MEF2 regulate a remarkably extensive array of transcription factor genes that propagate and amplify the signals initiated by MRFs. We found that MRFs play an unexpectedly wide-ranging role in directing the assembly and usage of the neuromuscular junction. Interestingly, these factors also prepare myoblasts to respond to diverse types of stress. Computational analyses identified novel combinations of factors that, depending on the differentiation state, might collaborate with MRFs. Our studies suggest unanticipated biological insights into muscle development and highlight new directions for further studies of genes involved in muscle repair and responses to stress and damage.


Figures

Figure 1.
Figure 1.
Identification of MRF and MEF2 targets. (A) Approach used to elucidate myogenic transcriptional networks. (MRFs) myogenic regulatory factors; (GO) Gene Ontology; (TFs) transcription factors; (PWMs) position-weight matrices. (B) Venn diagrams representing the overlap of MyoD targets in three different populations studied (left) and overlap of MyoD, myogenin, and MEF2 targets in myotubes (right). The total number of targets is indicated in parentheses. (C) ChIP assays in C2C12 myotubes with anti-MyoD and anti-myogenin antibodies, showing specific enrichment of selected target genes. (D) ChIP assays in C2C12 myotubes with anti-MEF2 and anti-myogenin antibodies. (E) Identification of MyoD targets in growing, primary human myoblasts using ChIP.
Figure 2.
Figure 2.
Distribution of Gene Ontology categories for biological function of MRF, MEF2, and E2F4 targets. (A) Histogram showing the distribution of GO categories for target genes bound by each factor in the indicated growth condition and the frequency of their occurrence. In some cases, genes appear in multiple categories. (B) Representation of components of the NMJ, showing MRF or MEF2 targets in green and yellow. Yellow indicates genes deregulated in MyoD-/- primary myoblasts. Protein interactions are indicated with bidirectional arrows.
Figure 3.
Figure 3.
Linking binding of MRFs and MEF2 with gene expression during myogenesis. We plotted the distribution of gene expression values [log2(MT/GM)] along the horizontal axis for all genes present in our factor binding and expression data sets. (MT and GM) Normalized Affymetrix expression values for myotubes and growing cells, respectively. Blue and black dots represent genes that are not bound or bound by the indicated factors, respectively. Expression profiling results comparing genes bound by the indicated factor in primary wild-type and MyoD-/- mouse myoblasts are indicated with red and green dots that represent genes whose expression is up-regulated or down-regulated by greater than twofold, respectively, in wild-type compared with KO. Dotted lines indicate the zone within which no significant change in expression occurred. All genes are displayed in identical positions along the X-axis to compare binding of factors and conditions.
Figure 4.
Figure 4.
A transcriptional regulatory network in muscle cells MRFs and MEF2 (large black triangles) are connected by arrows to their target genes. The expression patterns of each target are color-coded to reflect changes in expression patterns during differentiation: red or green if their expression level is at least twofold higher or lower, respectively, in myotubes than in the GM state. Orange nodes represent genes with intermediate expression ratios. Transcription factors (TFs) are represented by squares and are connected with black arrows. Other genes (non-TFs) are represented as circles and are connected by red arrows. Literature mining was used to add additional layers of control as follows: Genes shown previously to be regulated by at least two TFs that are bound by MRFs in our experiments or shown to be regulated by at least one MRF, are represented as circles and are connected by green (binding relationship indicated in TRANSFAC), cyan (literature mining), and blue (genes deregulated in tunicamycin-treated Atf4-/- fibroblasts) (Harding et al. 2003) arrows. (B) MRFs regulate the expression of transcriptional regulators that induce the expression of muscle function genes. (C) Feed-forward loops and complex network motifs are illustrated.

References

    1. Alon U. 2003. Biological networks: The tinkerer as an engineer. Science 301: 1866-1867. - PubMed
    1. Benezra R., Davis, R.L., Lockshon, D., Turner, D.L., and Weintraub, H. 1990. The protein Id: A negative regulator of helixloop-helix DNA binding proteins. Cell 61: 49-59. - PubMed
    1. Bergstrom D.A., Penn, B.H., Strand, A., Perry, R.L., Rudnicki, M.A., and Tapscott, S.J. 2002. Promoter-specific regulation of MyoD binding and signal transduction cooperate to pattern gene expression. Mol. Cell 9: 587-600. - PubMed
    1. Blais J.D., Filipenko, V., Bi, M., Harding, H.P., Ron, D., Koumenis, C., Wouters, B.G., and Bell, J.C. 2004. Activating transcription factor 4 is translationally regulated by hypoxic stress. Mol. Cell. Biol. 24: 7469-7482. - PMC - PubMed
    1. Buckingham M. 2001. Skeletal muscle formation in vertebrates. Curr. Opin. Genet. Dev. 11: 440-448. - PubMed

Publication types

MeSH terms