Identification and analysis of alternative splicing events conserved in human and mouse
- PMID: 15708978
- PMCID: PMC548664
- DOI: 10.1073/pnas.0409742102
Identification and analysis of alternative splicing events conserved in human and mouse
Abstract
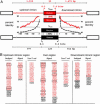
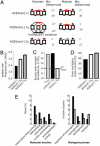
Alternative pre-mRNA splicing affects a majority of human genes and plays important roles in development and disease. Alternative splicing (AS) events conserved since the divergence of human and mouse are likely of primary biological importance, but relatively few of such events are known. Here we describe sequence features that distinguish exons subject to evolutionarily conserved AS, which we call alternative conserved exons (ACEs), from other orthologous human/mouse exons and integrate these features into an exon classification algorithm, acescan. Genome-wide analysis of annotated orthologous human-mouse exon pairs identified approximately 2,000 predicted ACEs. Alternative splicing was verified in both human and mouse tissues by using an RT-PCR-sequencing protocol for 21 of 30 (70%) predicted ACEs tested, supporting the validity of a majority of acescan predictions. By contrast, AS was observed in mouse tissues for only 2 of 15 (13%) tested exons that had EST or cDNA evidence of AS in human but were not predicted ACEs, and AS was never observed for 11 negative control exons in human or mouse tissues. Predicted ACEs were much more likely to preserve the reading frame and less likely to disrupt protein domains than other AS events and were enriched in genes expressed in the brain and in genes involved in transcriptional regulation, RNA processing, and development. Our results also imply that the vast majority of AS events represented in the human EST database are not conserved in mouse.
Figures


Similar articles
-
Identification and evolutionary analysis of novel exons and alternative splicing events using cross-species EST-to-genome comparisons in human, mouse and rat.BMC Bioinformatics. 2006 Mar 15;7:136. doi: 10.1186/1471-2105-7-136. BMC Bioinformatics. 2006. PMID: 16536879 Free PMC article.
-
Changes in alternative splicing of human and mouse genes are accompanied by faster evolution of constitutive exons.Mol Biol Evol. 2005 Nov;22(11):2198-208. doi: 10.1093/molbev/msi218. Epub 2005 Jul 27. Mol Biol Evol. 2005. PMID: 16049198
-
Transcriptome and genome conservation of alternative splicing events in humans and mice.Pac Symp Biocomput. 2004:66-77. doi: 10.1142/9789812704856_0007. Pac Symp Biocomput. 2004. PMID: 14992493
-
Conserved and species-specific alternative splicing in mammalian genomes.BMC Evol Biol. 2007 Dec 22;7:249. doi: 10.1186/1471-2148-7-249. BMC Evol Biol. 2007. PMID: 18154685 Free PMC article.
-
How prevalent is functional alternative splicing in the human genome?Trends Genet. 2004 Feb;20(2):68-71. doi: 10.1016/j.tig.2003.12.004. Trends Genet. 2004. PMID: 14746986 Review.
Cited by
-
Origins and impacts of new mammalian exons.Cell Rep. 2015 Mar 31;10(12):1992-2005. doi: 10.1016/j.celrep.2015.02.058. Epub 2015 Mar 19. Cell Rep. 2015. PMID: 25801031 Free PMC article.
-
Differentiated evolutionary rates in alternative exons and the implications for splicing regulation.BMC Evol Biol. 2006 Jun 22;6:50. doi: 10.1186/1471-2148-6-50. BMC Evol Biol. 2006. PMID: 16792801 Free PMC article.
-
Violating the splicing rules: TG dinucleotides function as alternative 3' splice sites in U2-dependent introns.Genome Biol. 2007;8(8):R154. doi: 10.1186/gb-2007-8-8-r154. Genome Biol. 2007. PMID: 17672918 Free PMC article.
-
SAPFIR: A webserver for the identification of alternative protein features.BMC Bioinformatics. 2022 Jun 24;23(1):250. doi: 10.1186/s12859-022-04804-w. BMC Bioinformatics. 2022. PMID: 35751026 Free PMC article.
-
Coupling mRNA processing with transcription in time and space.Nat Rev Genet. 2014 Mar;15(3):163-75. doi: 10.1038/nrg3662. Epub 2014 Feb 11. Nat Rev Genet. 2014. PMID: 24514444 Free PMC article. Review.
References
-
- Black, D. L. & Grabowski, P. J. (2003) Prog. Mol. Subcell. Biol. 31, 187–216. - PubMed
-
- Maniatis, T. & Tasic, B. (2002) Nature 418, 236–243. - PubMed
-
- Lopez, A. J. (1998) Annu. Rev. Genet. 32, 279–305. - PubMed
-
- Black, D. L. (2003) Annu. Rev. Biochem. 72, 291–336. - PubMed
-
- Black, D. L. (2000) Cell 103, 367–370. - PubMed
Publication types
MeSH terms
Grants and funding
LinkOut - more resources
Full Text Sources
Other Literature Sources
Research Materials
Miscellaneous

