

Interferon induction and/or production and its suppression by influenza A viruses
- PMID: 15709007
- PMCID: PMC548469
- DOI: 10.1128/JVI.79.5.2880-2890.2005
Interferon induction and/or production and its suppression by influenza A viruses
Erratum in
- J Virol. 2005 May;79(9):5887
Abstract
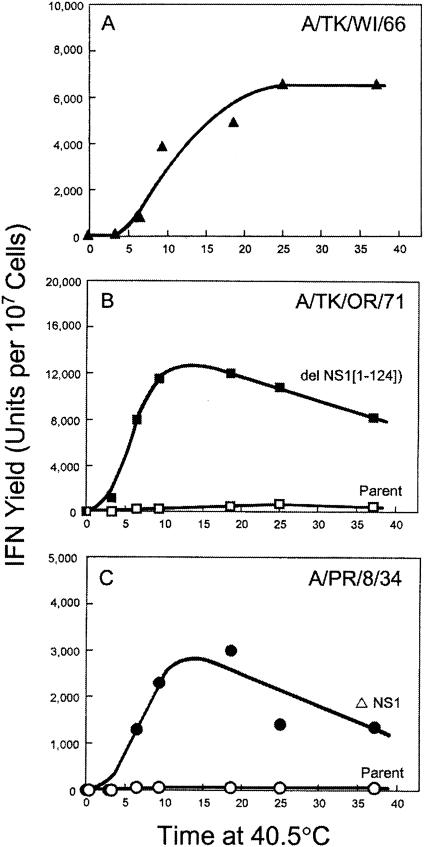
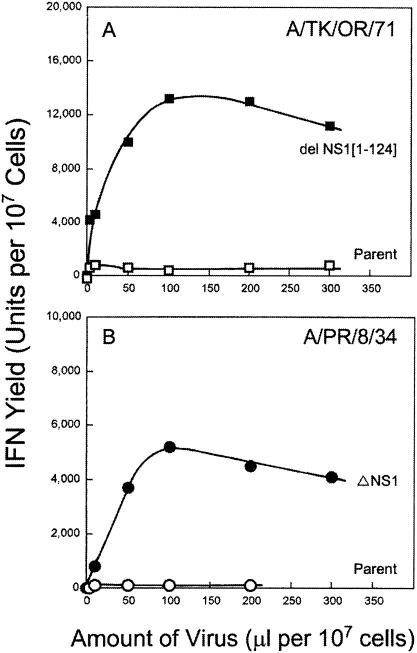
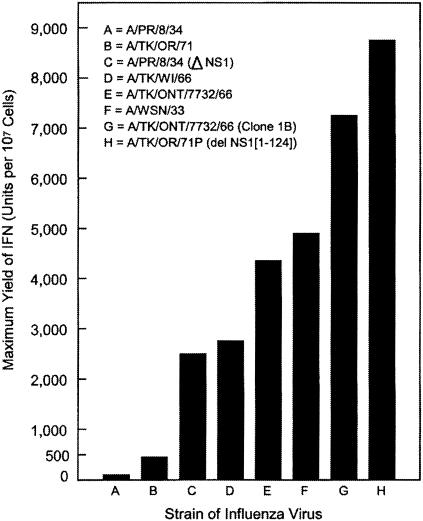
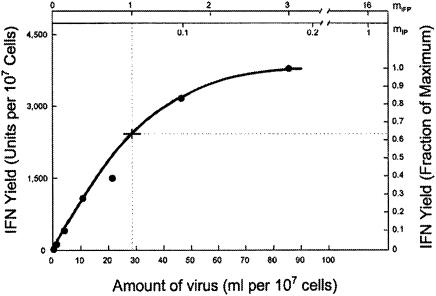
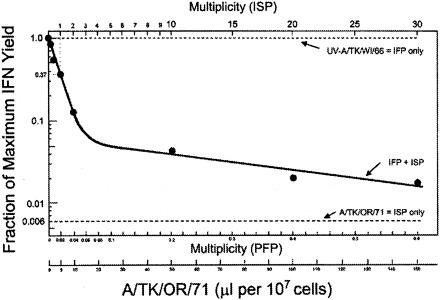
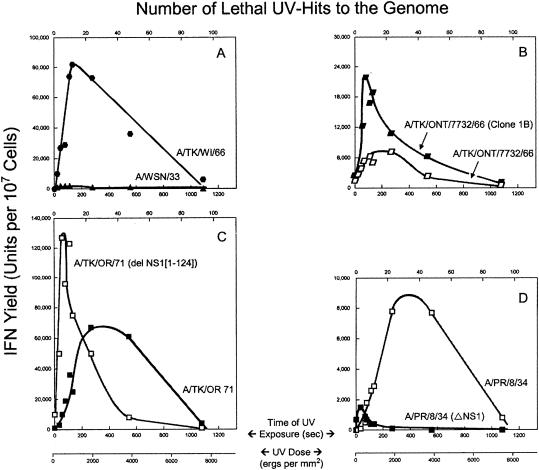
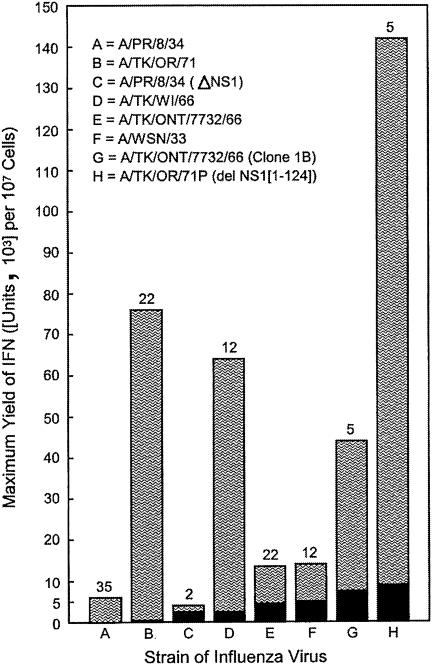
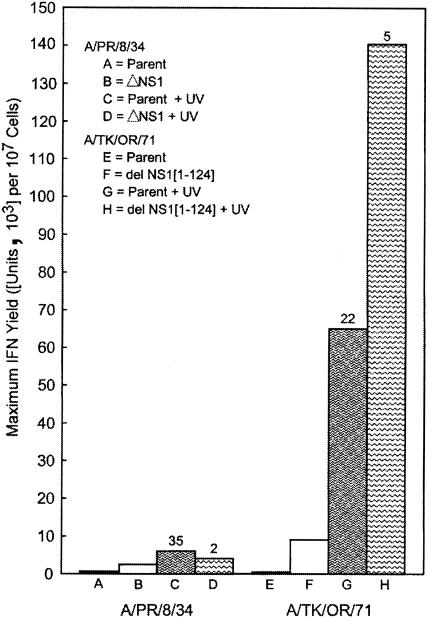
Developmentally aged chicken embryo cells which hyperproduce interferon (IFN) when induced were used to quantify IFN production and its suppression by eight strains of type A influenza viruses (AIV). Over 90% of the IFN-inducing or IFN induction-suppressing activity of AIV populations resided in noninfectious particles. The IFN-inducer moiety of AIV appears to preexist in, or be generated by, virions termed IFN-inducing particles (IFP) and was detectable under conditions in which a single molecule of double-stranded RNA introduced into a cell via endocytosis induced IFN, whereas single-stranded RNA did not. Some AIV strains suppressed IFN production, an activity that resided in a noninfectious virion termed an IFN induction-suppressing particle (ISP). The ISP phenotype was dominant over the IFP phenotype. Strains of AIV varied 100-fold in their capacity to induce IFN. AIV genetically compromised in NS1 expression induced about 20 times more IFN than NS1-competent parental strains. UV irradiation further enhanced the IFN-inducing capacity of AIV up to 100-fold, converting ISP into IFP and IFP into more efficient IFP. AIV is known to prevent IFN induction and/or production by expressing NS1 from a small UV target (gene NS). Evidence is presented for an additional downregulator of IFN production, identified as a large UV target postulated to consist of AIV polymerase genes PB1 + PB2 + PA, through the ensuing action of their cap-snatching endonuclease on pre-IFN-mRNA. The products of both the small and large UV targets act in concert to regulate IFN induction and/or production. Knowledge of the IFP/ISP phenotype may be useful in the development of attenuated AIV strains that maximally induce cytokines favorable to the immune response.
Figures
Similar articles
-
Influenza virus subpopulations: interferon induction-suppressing particles require expression of NS1 and act globally in cells; UV irradiation of interferon-inducing particles blocks global shut-off and enhances interferon production.J Interferon Cytokine Res. 2013 Feb;33(2):72-9. doi: 10.1089/jir.2012.0075. Epub 2012 Nov 6. J Interferon Cytokine Res. 2013. PMID: 23131171
-
Influenza virus: a single noninfectious interferon induction-suppressing particle blocks expression of interferon-inducing particles.J Interferon Cytokine Res. 2012 Mar;32(3):121-6. doi: 10.1089/jir.2011.0078. Epub 2011 Dec 2. J Interferon Cytokine Res. 2012. PMID: 22136418
-
Amelioration of influenza virus pathogenesis in chickens attributed to the enhanced interferon-inducing capacity of a virus with a truncated NS1 gene.J Virol. 2007 Feb;81(4):1838-47. doi: 10.1128/JVI.01667-06. Epub 2006 Nov 22. J Virol. 2007. PMID: 17121796 Free PMC article.
-
Interferon induction: regulation by both virus and cell.Hokkaido Igaku Zasshi. 1994 Nov;69(6):1320-31. Hokkaido Igaku Zasshi. 1994. PMID: 7535726 Review.
-
Modulation of Innate Immune Responses by the Influenza A NS1 and PA-X Proteins.Viruses. 2018 Dec 12;10(12):708. doi: 10.3390/v10120708. Viruses. 2018. PMID: 30545063 Free PMC article. Review.
Cited by
-
Induction and Evasion of Type-I Interferon Responses during Influenza A Virus Infection.Cold Spring Harb Perspect Med. 2021 Oct 1;11(10):a038414. doi: 10.1101/cshperspect.a038414. Cold Spring Harb Perspect Med. 2021. PMID: 32661015 Free PMC article. Review.
-
Unusual dengue virus 3 epidemic in Nicaragua, 2009.PLoS Negl Trop Dis. 2011 Nov;5(11):e1394. doi: 10.1371/journal.pntd.0001394. Epub 2011 Nov 8. PLoS Negl Trop Dis. 2011. PMID: 22087347 Free PMC article.
-
HIF-1α is a negative regulator of interferon regulatory factors: Implications for interferon production by hypoxic monocytes.Proc Natl Acad Sci U S A. 2021 Jun 29;118(26):e2106017118. doi: 10.1073/pnas.2106017118. Proc Natl Acad Sci U S A. 2021. PMID: 34108245 Free PMC article.
-
Clonogenic assay of type a influenza viruses reveals noninfectious cell-killing (apoptosis-inducing) particles.J Virol. 2008 Mar;82(6):2673-80. doi: 10.1128/JVI.02221-07. Epub 2008 Jan 9. J Virol. 2008. PMID: 18184709 Free PMC article.
-
Induction and evasion of type I interferon responses by influenza viruses.Virus Res. 2011 Dec;162(1-2):12-8. doi: 10.1016/j.virusres.2011.10.017. Epub 2011 Oct 21. Virus Res. 2011. PMID: 22027189 Free PMC article. Review.
References
-
- Abraham, G. 1979. The effect of ultraviolet radiation on the primary transcription of influenza virus messenger RNAs. Virology 97:177-182. - PubMed
-
- Barry, R. D. 1961. The multiplication of influenza virus. II. Multiplicity reactivation of ultraviolet-irradiated virus. Virology 14:398-405. - PubMed
-
- Bean, W. J., and R. W. Simpson. 1973. Primary transcription of the influenza virus genome in permissive cells. Virology 56:646-651. - PubMed
Publication types
MeSH terms
Substances
LinkOut - more resources
Full Text Sources
Miscellaneous
