

Review
Diffusion-weighted imaging of acute excitotoxic brain injury
Affiliations
- PMID: 15709116
- PMCID: PMC7974100
Item in Clipboard
Review
Diffusion-weighted imaging of acute excitotoxic brain injury
AJNR Am J Neuroradiol.
2005 Feb.
No abstract available
Figures
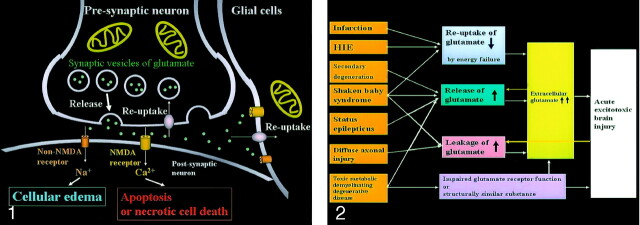
Excitotoxic mechanisms in the neuron glial unit. Glutamate is released from the presynaptic neuron into the synaptic cleft. It then undergoes reuptake into the presynaptic neuron and adjacent glial cells. Mitochondria provide energy for the reuptake. Excessive glutamate binding to non-NMDA receptors allows entry of Na+ into the postsynaptic neuron, resulting in cytotoxic edema; excessive glutamate binding to NMDA receptors allows entry of Ca2+ into the postsynaptic neuron, causing necrotic cell death or apoptosis (From Moritani T, Ekholm S, Westesson PL. Diffusion-Weighted MR Imaging of the Brain. Berlin: Springer-Verlag; 2004. Used with permission.)
Acute excitotoxic brain injury in various diseases associated with acute excitotoxic brain injury. Mechanisms are classified by 1) decreased reuptake; 2) increased release; 3) leakage due to disruption of axonal membranes; and 4) others, including impaired glutamate receptor function or a substance structurally similar to glutamate. Combinations of mechanisms vary according to each disease process. Two positive feedback loops (yellow arrow) are present: 1) Increased extracellular glutamate depolarizes adjacent neurons that release intracellular glutamate, and 2) neuronal injury causes leakage of glutamate. These make this mechanism self-propagating via neuron-glial cell units and via transaxonal or transynaptic routes along the fiber tracts.
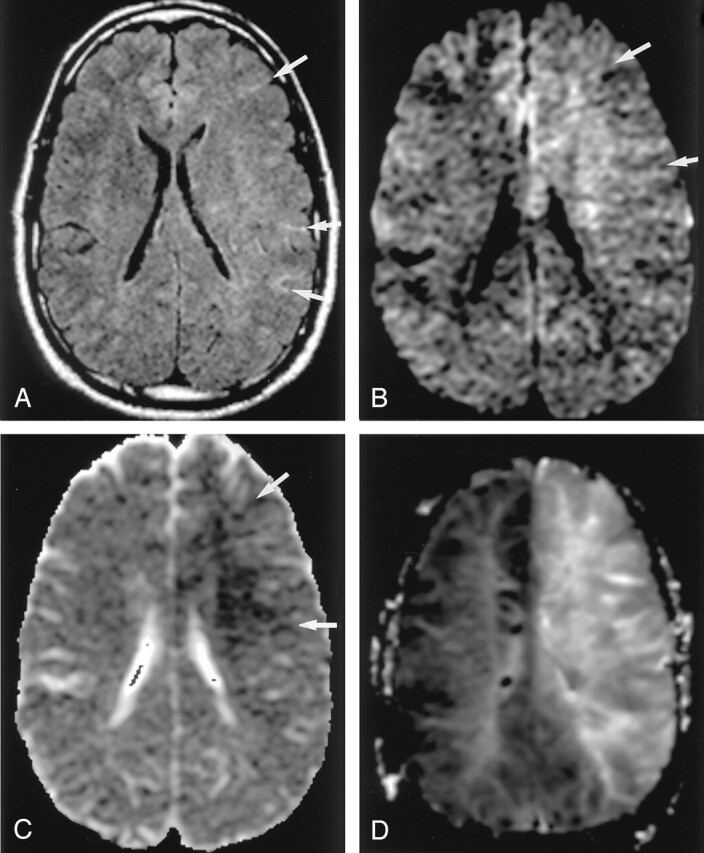
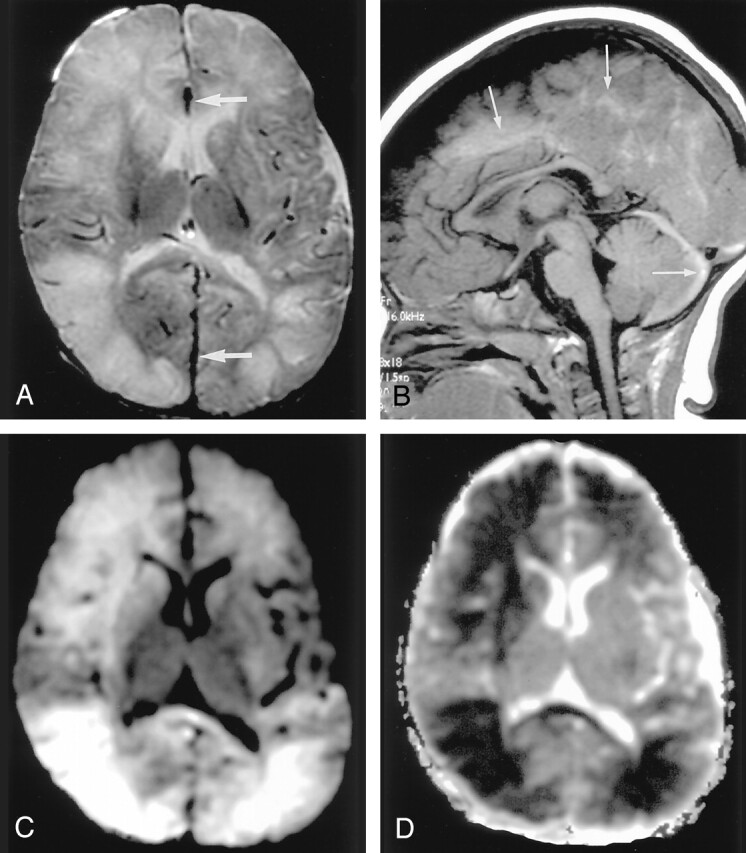
Hyperacute infarction (2 hours after onset) in a 39-year-old man with the left internal carotid artery dissection presenting with right-sided weakness. (From Moritani T, Ekholm S, Westesson PL. Diffusion-Weighted MR Imaging of the Brain. Berlin: Springer-Verlag; 2004. Used with permission.) A, Fluid-attenuated inversion recovery (FLAIR) image shows no apparent parenchymal abnormalities, but linear hyperintensities represent slow flow in the peripheral vessels (arrows). B and C, DW images show a mildly hyperintense lesion with decreased ADC in the left frontoparietal white matter; this represents cytotoxic edema extending into the ischemic penumbra, propagated by excitotoxic mechanisms (arrows). D, Perfusion-weighted image shows prolonged mean time to peak in the entire left MCA and anterior cerebral artery territories.
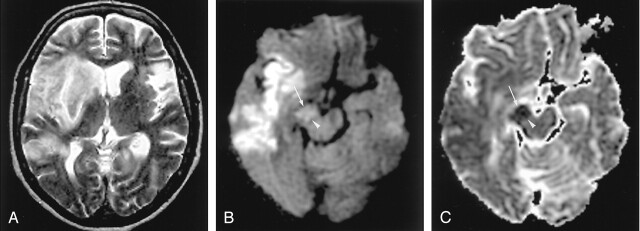
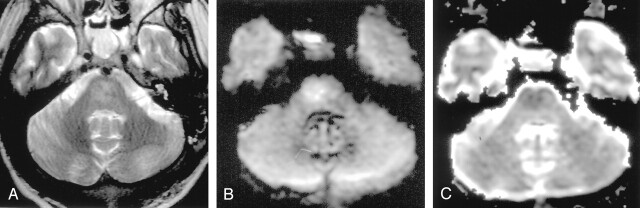
Wallerian degeneration in a 76-year-old man with a large right MCA infarct (6 days after onset). A, T2-weighted image shows a hyperintense right MCA infarct, including the left putamen and caudate head. B and C, DW images at the level of the midbrain reveal hyperintense lesions with decreased ADC, not only in the right MCA are, but also in the right cerebral peduncle (arrow) including the substantia nigra (arrowhead). This finding is presumably due to the excitotoxic injury propagated through transaxonal and transynaptic routes along the fiber tracts.
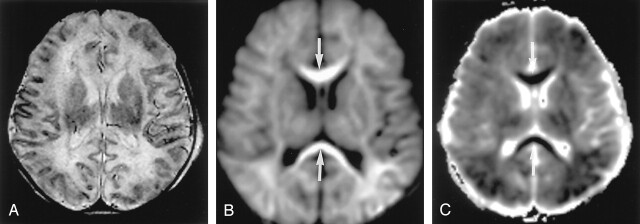
Neonatal HIE in a 6-day-old boy with profound perinatal asphyxia. A, On the T2-weighted image, gray matter–white matter delineation is partially obliterated. The anterior and posterior aspects of the corpus callosum show high signal intensity. B and C, DW images show diffuse hyperintensity with decreased ADC in the corpus callosum (arrows), internal capsules, thalami, and white matter. This distribution may be related to excitatory circuits. The neonatal brain seems to be highly vulnerable to acute excitotoxic injury.
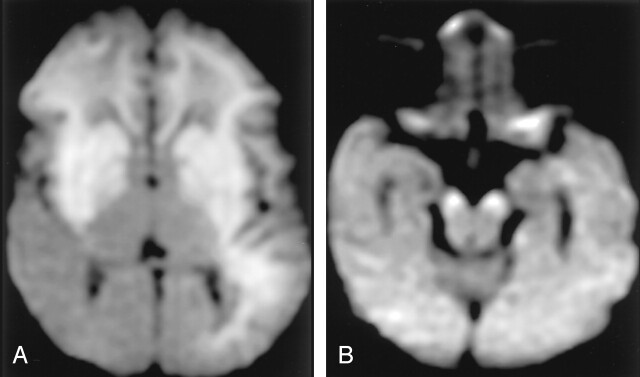
Neonatal HIE in a 10-day-old boy with profound perinatal asphyxia. A, DW image shows extensive hyperintense lesions involving the frontotemporoparietal white matter, internal capsules, and basal ganglia. B, DW image at the level of the midbrain shows hyperintense lesions with decreased ADC (not shown) in the bilateral cerebral peduncles. These findings represent the early phase of wallerian degeneration.
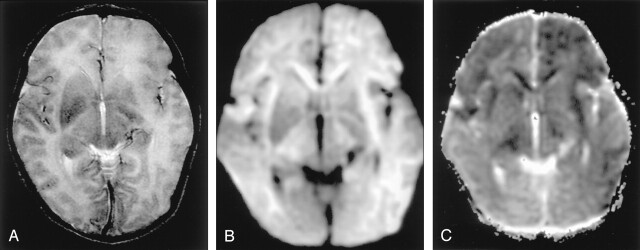
Shaken baby syndrome in a 2-year-old girl. A, T2-weighted image shows bilateral hyperintense lesions in the frontal and temporo-occipital lobes, basal ganglia, and corpus callosum. Subdural hematomas are seen as linear, hypointense lesions along the interhemispheric fissure (arrows). B, T1-weighted image shows subdural hematomas in the posterior fossa in addition to the interhemispheric fissure (arrows). C and D, DW images show the brain parenchymal injury as hyperintense with decreased ADC that represents cytotoxic edema presumably due to injuries with combined excitotoxic mechanisms.
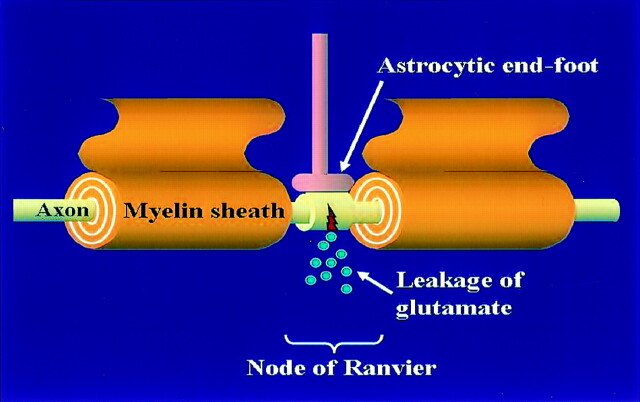
Diffuse axonal injury is presumably due to the leakage of glutamate at the node of Ranvier. The astrocytic end-foot is located on the axon at the node of Ranvier and may protect the axons.
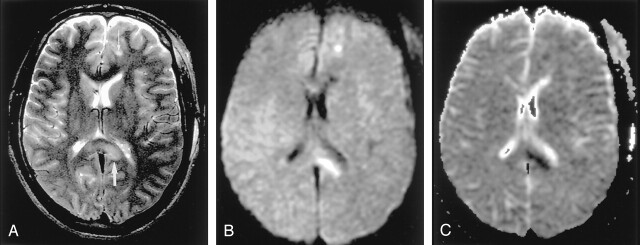
Diffuse axonal injury in a 20-year-old man after motor vehicle accident. A, T2-weighted image shows hyperintense lesions in the splenium of the corpus callosum and left frontal gray matter–white matter junction (arrows). B and C, DW images show these lesions as hyperintense with decreased ADC; they represent cytotoxic edema presumably due to the leakage of glutamate from the axon.
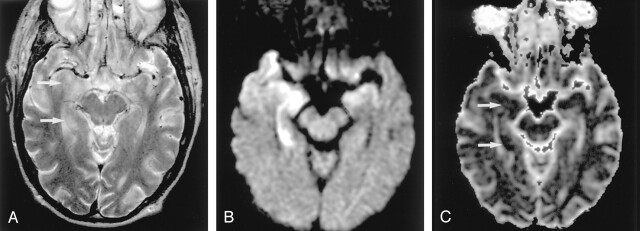
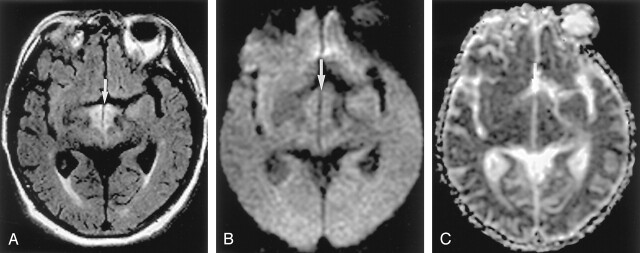
Herpes encephalitis type 1 in a 48-year-old man presenting with headache and fever. A, T2-weighted image shows hyperintense lesions in both medial temporal lobes, including the right hippocampus (arrows). B, DW image clearly shows these bilateral lesions as hyperintense. C, ADC maps show partially decreased ADC of these lesions (arrows).
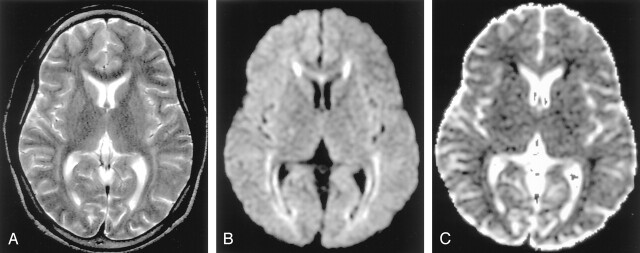
Herpes encephalitis type 2 in a 2-week-old girl. A, T2-weighted image shows bilateral hyperintense lesions in the basal ganglia, thalami, and frontotemporal regions. B and C, DW images show asymmetric but extensive hyperintense lesions with decreased ADC in these areas. This extensive distribution of the lesions is presumably related to vulnerability of the developing brain to excitotoxic injury.
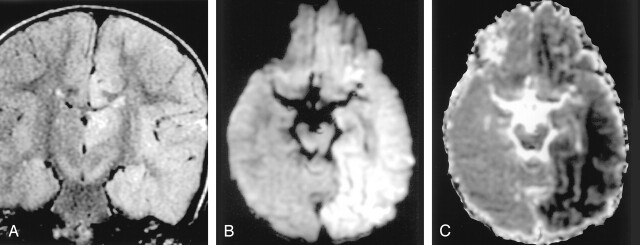
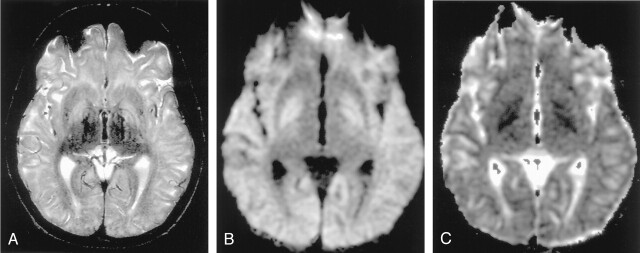
Status epilepticus in a 2-year-old girl. A, Coronal FLAIR image shows diffuse hyperintense lesions in the left hemisphere including the left thalamus, cingulate gyrus, and hippocampus. B and C, DW images show these lesions as hyperintense with decreased ADC. They represent cytotoxic edema due to excitotoxic injury mediated by neuronal seizure activity. These lesions were partially reversed on follow-up MR imaging (not shown).
Focal lesion in the splenium of the corpus callosum in a 9-year-old child with intractable partial seizures beginning at age 4. A, T2-weighted image 3 days after a seizure shows a discrete, focal hyperintense lesion in the central portion of the splenium (arrow). B and C, DW images show this lesion as hyperintense and associated with decreased ADC.
Central pontine myelinolysis in a 14-year-old female adolescent. (From Moritani T, Ekholm S, Westesson PL. Diffusion-Weighted MR Imaging of the Brain. Berlin: Springer-Verlag; 2004. Used with permission.) A, T2-weighted image shows a hyperintense lesion in the pons. B and C, DW images show this lesion a hyperintense with mildly decreased ADC. This finding represents cytotoxic edema seen in the early phase of central pontine myelinolysis
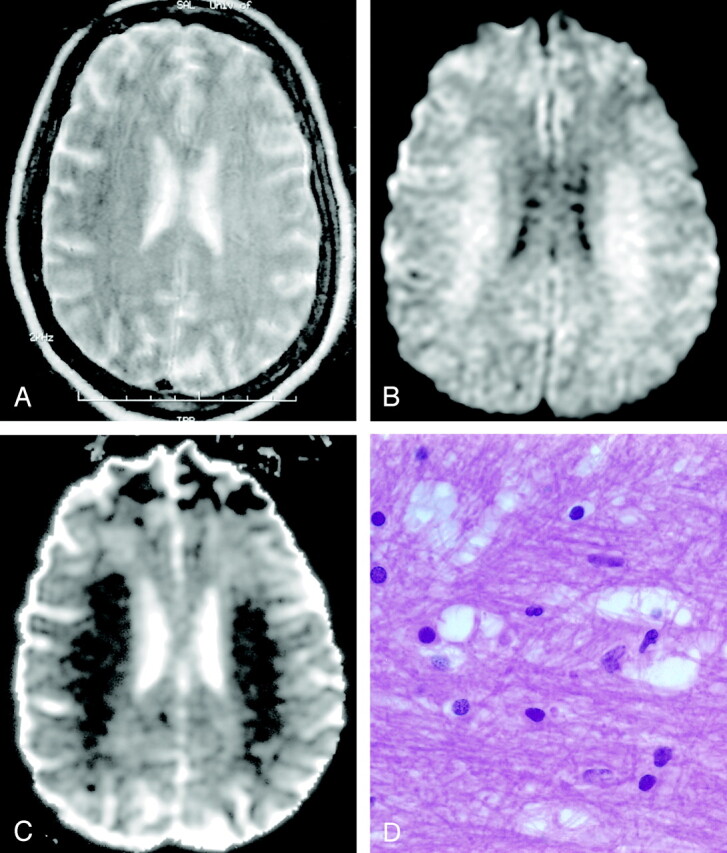
Methotrexate leukoencephalopathy in a 50-year-old woman. (From Moritani T, Ekholm S, Westesson PL. Diffusion-Weighted MR Imaging of the Brain. Berlin: Springer-Verlag; 2004. Used with permission.) A, T2-weighted image is normal. B, DW image shows diffuse hyperintensity in the bilateral corona radiata and extending into the central semiovale. C, ADC map shows diffuse white matter lesions with decreased ADC, which represents pure cytotoxic edema presumably due to the enzymatic release of glutamate. D, Pathologic specimen shows pure intramyelinic edema.
Phenylketonuria in a 36-year-old man. (From Moritani T, Ekholm S, Westesson PL. Diffusion-Weighted MR Imaging of the Brain. Berlin: Springer-Verlag; 2004. Used with permission.) A, T2-weighted image shows hyperintense lesions in the periventricular white matter. B and C, DW image shows these lesions as hyperintense with decreased ADC. Excitotoxicity may be related to impairment of glutamate receptor function by l -phenylalanine.
Glutaric aciduria in a 13-year-old male adolescent. A, T2-weighted image shows hyperintense lesions in the bilateral globus pallidus (arrows) and diffusely in the white matter. B and C, DW image shows these lesions as hyperintense with decreased ADC. Excitotoxic injury may be due to an accumulation of organic acids that share structural similarities with glutamate.
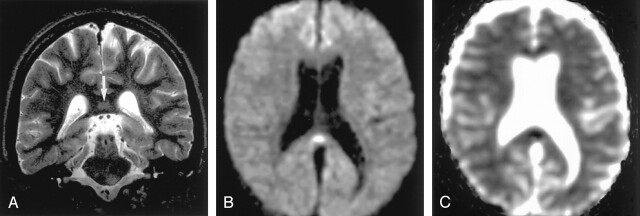
Wernicke encephalopathy in a 75-year-old man. (From Moritani T, Ekholm S, Westesson PL. Diffusion-Weighted MR Imaging of the Brain. Berlin: Springer-Verlag; 2004. Used with permission.) A, FLAIR image shows a symmetrically hyperintense lesion in the hypothalami (arrow). B and C, DW image shows isointense lesions with mildly increased ADC in the hypothalami that may represent vasogenic edema (arrow). Release of glutamate into the extracellular space may cause lesions in Wernicke encephalopathy.
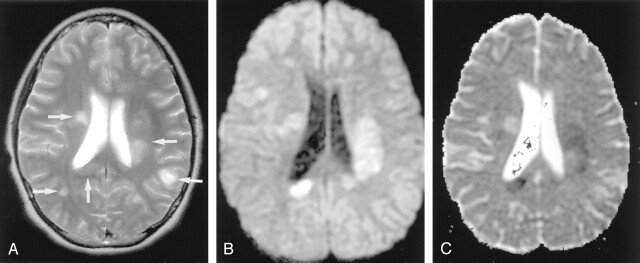
Acute multiple sclerosis in a 13-year-old female adolescent. A, T2-weighted image shows multiple hyperintense lesions in the periventricular subcortical white matter and corpus callosum (arrows). B and C, DW image shows some lesions as hyperintense with decreased ADC. They represent cytotoxic plaques presumably related to excitotoxic injury of oligodendrocytes, myelin sheaths, and axons.
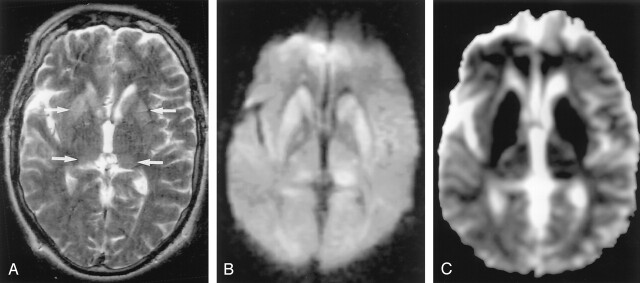
CJD in a 51-year-old man with progressive dementia. (From Moritani T, Ekholm S, Westesson PL. Diffusion-Weighted MR Imaging of the Brain. Berlin: Springer-Verlag; 2004. Used with permission.) A, T2-weighted image demonstrates mild hyperintensity bilaterally in the caudate nuclei, putamina, and pulvinar of the thalami (arrows). B, DW image clearly demonstrates hyperintense lesions in these areas. C, ADC is decreased in these lesions, which may represent cellular edema. The distribution of these lesions may be related to dysfunction of glutamate receptors.
References
-
- Hassel B, Boudingh KA, Narvesen C, et al. Glutamate transport, glutamine synthase and phosphate-activated glutamimnase in rat CNS white matter. A quantitative study. J Neurochem 2003;87:230–237 - PubMed
-
- Lipton SA, Rosenberg PA. Excitatory amino acids as a final common pathway for neurologic disorders. N Engl J Med 1994;330:613–622 - PubMed
-
- Sharp FR, Swanson RA, Honkaniemi J, et al. Neurochemistry and molecular biology. In: Barnett HJM, Mohr JP, Stein BM, et al. Stroke Pathophysiology, Diagnosis, and Management. 1998;54–56
-
- Buchan AM, Slivka A, Xue D. The effect of the NMDA receptor antagonist MK-801 on cerebral blood flow and infarct volume in experimental focal stroke. Brain Res 1992;574:171–177 - PubMed
-
- Ogawa T, Okudera T, Inugami A, et al. Degeneration of the ipsilateral substantia nigra after striatal infarction: evaluation with MR imaging. Radiology 1997;204:847–851 - PubMed
Publication types
MeSH terms
Substances
LinkOut - more resources
Full Text Sources
Medical