

Spontaneous intracerebral hematoma on diffusion-weighted images: influence of T2-shine-through and T2-blackout effects
- PMID: 15709118
- PMCID: PMC7974085
Spontaneous intracerebral hematoma on diffusion-weighted images: influence of T2-shine-through and T2-blackout effects
Abstract
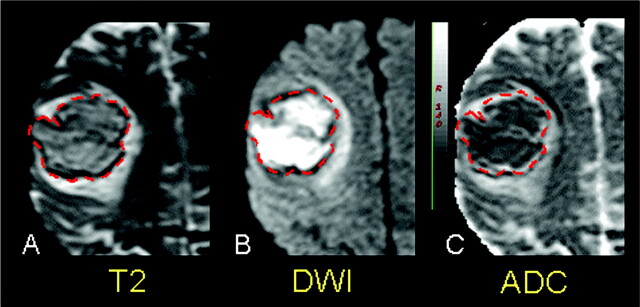
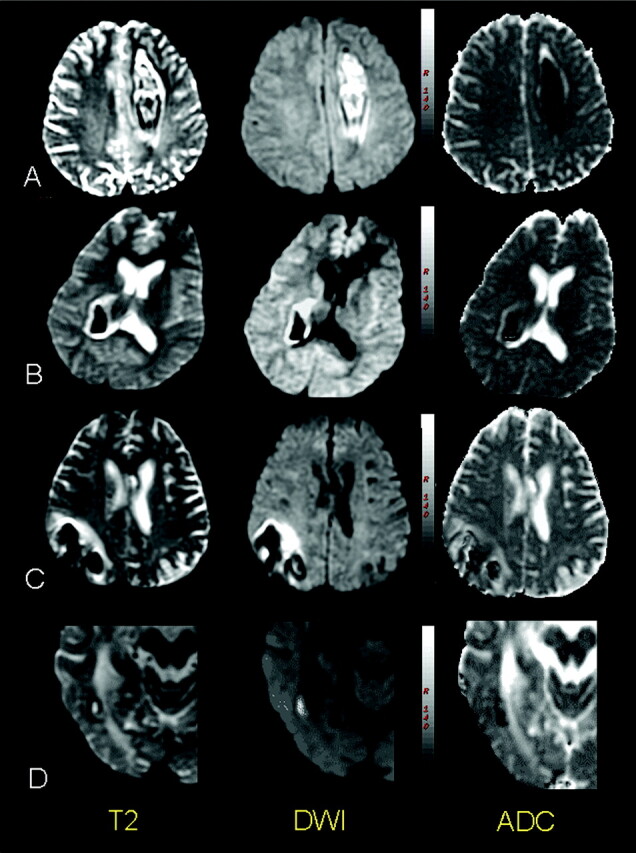
Background and purpose: On diffusion-weighted (DW) images, primary hematomas are initially mainly hyperintense, and then hypointense during the first few days after stroke onset. As in other brain disorders, variations in the T2 relaxation time of the hematoma influence the DW imaging signal intensity. Our aim was to evaluate the contribution of the T2 signal intensity and apparent diffusion coefficient (ADC) changes to signal intensity displayed by DW imaging through the course of hematoma.
Methods: The MR images of 33 patients with primary intracranial hemorrhage were retrospectively reviewed. Variations in T2-weighted echo planar images, DW imaging signal intensity, and apparent diffusion coefficient (ADC) ratios (core of hematoma/contralateral hemisphere) were analyzed according to the putative stages of hematoma, as seen on T1- and T2-weighted images.
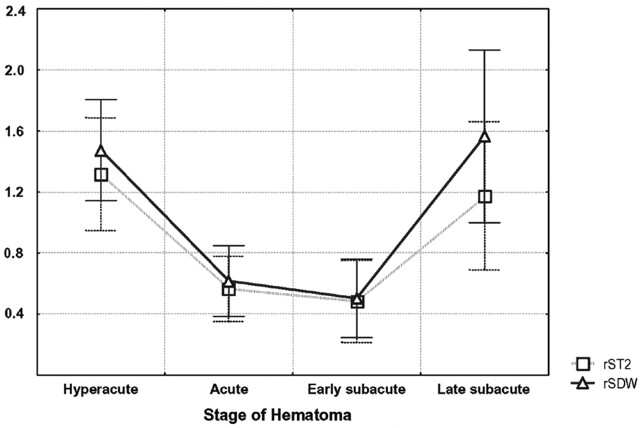
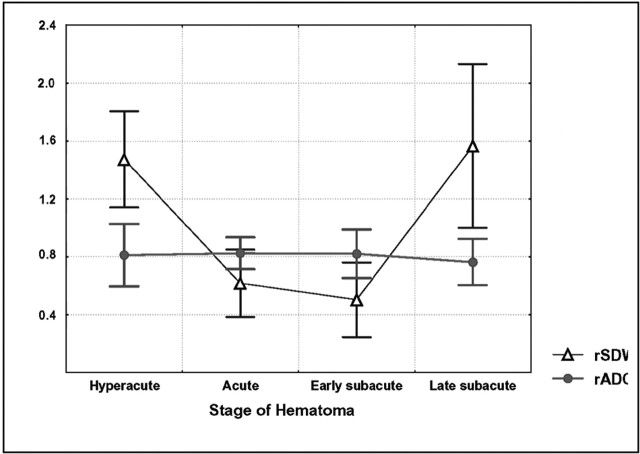
Results: On both T2-weighted echo planar and DW images, the core of the hematomas was hyperintense at the hyperacute (oxyhemoglobin, n = 11) and late subacute stages (extracellular methemoglobin, n = 4), while being hypointense at the acute (deoxyhemoglobin, n = 11) and early subacute stages (extracellular methemoglobin, n = 7). There was a positive correlation between the signal intensity ratio on T2-weighted echo planar and DW images (r = 0.93, P < .05). ADC ratios were significantly decreased in the whole population and in each of the first three stages of hematoma, without any correlation between DW imaging findings and ADC changes (r = 0.09, P = .6).
Conclusion: Our results confirm that the core of hematomas is hyperintense on DW images with decreased ADC values at the earliest time point, and may thus mimic arterial stroke on DW images. T2 shine-through and T2 blackout effects contribute to the DW imaging findings of hyperintense and hypointense hematomas, respectively, while ADC values are moderately but consistently decreased during the first three stages of hematoma.
Figures
Similar articles
-
Diffusion-weighted MR imaging of intracerebral hemorrhage.Korean J Radiol. 2001 Oct-Dec;2(4):183-91. doi: 10.3348/kjr.2001.2.4.183. Korean J Radiol. 2001. PMID: 11754324 Free PMC article.
-
Evolution of intramural duodenal hematomas on magnetic resonance imaging.Pediatr Radiol. 2018 Oct;48(11):1593-1599. doi: 10.1007/s00247-018-4178-9. Epub 2018 Aug 14. Pediatr Radiol. 2018. PMID: 30109380
-
Acute cerebral infarction: quantification of spin-density and T2 shine-through phenomena on diffusion-weighted MR images.Radiology. 1999 Aug;212(2):333-9. doi: 10.1148/radiology.212.2.r99au36333. Radiology. 1999. PMID: 10429687
-
MR appearance of hemorrhage in the brain.Radiology. 1993 Oct;189(1):15-26. doi: 10.1148/radiology.189.1.8372185. Radiology. 1993. PMID: 8372185 Review.
-
Diffusion-weighted MR of the brain: methodology and clinical application.Radiol Med. 2005 Mar;109(3):155-97. Radiol Med. 2005. PMID: 15775887 Review. English, Italian.
Cited by
-
Pediatric skeletal diffusion-weighted magnetic resonance imaging: part 1 - technical considerations and optimization strategies.Pediatr Radiol. 2021 Aug;51(9):1562-1574. doi: 10.1007/s00247-021-04975-3. Epub 2021 Apr 1. Pediatr Radiol. 2021. PMID: 33792751 Review.
-
Pitfalls of diffusion-weighted imaging of the female pelvis.Radiol Bras. 2018 Jan-Feb;51(1):37-44. doi: 10.1590/0100-3984.2016.0208. Radiol Bras. 2018. PMID: 29559764 Free PMC article. Review.
-
Standard Diffusion-Weighted Imaging in the Brain Can Detect Cervical Internal Carotid Artery Dissections.AJNR Am J Neuroradiol. 2020 Feb;41(2):318-322. doi: 10.3174/ajnr.A6383. Epub 2020 Jan 16. AJNR Am J Neuroradiol. 2020. PMID: 31948949 Free PMC article.
-
Indeterminate adnexal masses at ultrasound: effect of MRI imaging findings on diagnostic thinking and therapeutic decisions.Eur Radiol. 2011 Jun;21(6):1301-10. doi: 10.1007/s00330-010-2018-x. Epub 2010 Dec 21. Eur Radiol. 2011. PMID: 21174097
-
Pitfalls of Diffusion-Weighted Imaging: Clinical Utility of T2 Shine-through and T2 Black-out for Musculoskeletal Diseases.Diagnostics (Basel). 2023 May 7;13(9):1647. doi: 10.3390/diagnostics13091647. Diagnostics (Basel). 2023. PMID: 37175036 Free PMC article. Review.
References
-
- Qureshi A, Tuhrim S, Broderick J, et al. Spontaneous intracerebral hemorrhage. N Engl J Med 2001;344:1450–1460 - PubMed
-
- Linfante I, Llinas RH, Caplan LR, Warach S. MRI features of intracerebral hemorrhage within 2 hours from symptom onset. Stroke 1999;30:2263–2267 - PubMed
-
- Patel MR, Edelman RR, Warach S. Detection of hyperacute primary intraparenchymal hemorrhage by magnetic resonance imaging. Stroke 1996;27:2321–2324 - PubMed
-
- Schellinger PD, Jansen O, Fiebach JB, Hacke W, Sartor K. A standardized MRI stroke protocol: comparison with CT in hyperacute intracerebral hemorrhage. Stroke 1999;30:765–768 - PubMed
-
- Fiebach JB, Schellinger PD, Gass A, et al. Stroke magnetic resonance imaging is accurate in hyperacute intracerebral hemorrhage. A multicenter study on the validity of stroke imaging. Stroke 2004;22:1–5 - PubMed
MeSH terms
LinkOut - more resources
Full Text Sources
Research Materials