. 2005 Feb;26(2):289-97.

West Nile virus infection: MR imaging findings in the nervous system

Affiliations

West Nile virus infection: MR imaging findings in the nervous system

Muhammad Ali et al. AJNR Am J Neuroradiol. 2005 Feb.

Abstract

Background and purpose: West Nile virus (WNV) infection is an ongoing seasonal epidemic. We correlated the MR imaging findings with the clinical presentations and outcomes of WNV infection.

Methods: We reviewed 14 brain and three spinal MR images: nonenhanced and contrast-enhanced T1-weighted images (T1WIs) and T2-weighted images (T2WIs), nonenhanced fluid-attenuated inversion recovery (FLAIR) images (11 patients) and enhanced FLAIR images (three patients), with diffusion-weighted (DW) images and apparent diffusion coefficient maps. WNV infection was diagnosed by means of enzyme-linked immunosorbent assay with a plaque reduction neutralization test. We also correlated the MR findings with the clinical presentation, course, and outcome to determine their prognostic importance.

Results: MR imaging findings included: 1) normal (five patients); 2) DW imaging-only abnormalities in the white matter, corona radiata, and internal capsule (four patients); 3) hyperintensity on FLAIR images and T2WIs in the lobar gray and white matter, cerebellum, basal ganglia, thalamus and internal capsule, pons and midbrain (three patients); 4) meningeal involvement (two patients); and 5) spinal cord, cauda equina, and nerve root involvement (three patients). All patients with finding 1 and all but one with finding 2 recovered completely. Two patients with finding 3 died. Those with finding 4 or 5 had residual neurologic deficits that were severe or moderate to severe, respectively.

Conclusion: Patients with normal MR images or abnormalities on only DW images had the best prognosis, while those with abnormal signal intensity on T2WI and FLAIR images had the worst outcomes. No definite predilection for any specific area of the brain parenchyma was noted.


Figures
F<sc>ig</sc> 1.
Fig 1.
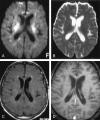
Patient with isolated restricted diffusion. A and B, DW image (A) and ADC map (B) show restricted diffusion in the PLIC. C and D, Findings on corresponding FLAIR image (C) and contrast-enhanced T1WI (D) are unremarkable.
F<sc>ig</sc> 2.
Fig 2.
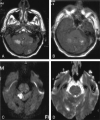
Isolated restricted diffusion in a patient who recovered without residual symptoms. A, DW image shows asymmetric (right greater than left) high signal intensity in the superior corona radiata and subcortical white matter. B, Corresponding ADC map shows subtle low signal intensity. C, No abnormalities are present on the FLAIR image.
F<sc>ig</sc> 3.
Fig 3.
Images at the level of the basal ganglia and sylvian fissure in a patient with hyperintensity on FLAIR images. A, Contrast-enhanced FLAIR image shows increased signal intensity in the basal ganglia and PLIC bilaterally, left thalamus, and left periventricular white matter, as well as the temporoparietal and occipital sulci. B, Contrast-enhanced T1WI shows no corresponding enhancement. C and D, DW image (C) and ADC map (D) show restricted diffusion is seen in the left periventricular white matter, right basal ganglia, and bilateral PLIC. E and F, Contiguous FLAIR images show increased signal intensity in the midbrain and medial temporal lobes bilaterally, as well as in the right temporal lobe peripherally. Hyperintensity is again shown in the sulci, signifying WNV meningoencephalitis.
F<sc>ig</sc> 4.
Fig 4.
Another patient with hyperintense parenchymal abnormalities on FLAIR images. A, FLAIR image demonstrates increased signal intensity in the bilateral cerebellum and in the left occipital lobe. B, Contrast-enhanced T1WI shows the same areas of enhancement. C and D, Corresponding DW image (C) and ADC map (D) show diffusion restriction in the right cerebellum.
F<sc>ig</sc> 5.
Fig 5.
Patient with meningeal involvement. A, Axial contrast-enhanced FLAIR image shows increased signal intensity in the sulci compatible with meningitis. B, Abnormality is not appreciated on the corresponding contrast-enhanced T1WI.
F<sc>ig</sc> 6.
Fig 6.
Patient 2 with meningeal involvement. A, Coronal gadolinium-enhanced T1WI shows abnormal enhancement of the tentorial meninges and focal increased meningeal enhancement in the left parietal lobe. Arrows indicate subtle enhancement in the sulci. B and C, FLAIR images show increased signal intensity in the sulci, more prominent on the left than on the right.
F<sc>ig</sc> 7.
Fig 7.
Patient with intraspinal abnormalities. A, Axial contrast-enhanced T1WI through the region of the cauda equina shows marked abnormal enhancement of the nerve roots, which appear as bright dots in the thecal sac. B, Sagittal gadolinium-enhanced T1WI demonstrates prominently enhancing nerve roots.
F<sc>ig</sc> 8.
Fig 8.
Another patient with intraspinal abnormalities. A, Sagittal T2WI shows abnormal increased signal intensity in the conus medullaris. B, Axial gadolinium-enhanced T1WI shows abnormal foci of enhancement in the conus medullaris. C, Axial T2WI shows markedly increased signal intensity in the thoracic cord. This is appreciated despite image degradation due to artifact.
F<sc>ig</sc> 9.
Fig 9.
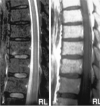
Subtle thoracic cord signal abnormalities in a patient with moderate-to-severe neurologic deficits. A, Sagittal T2WI demonstrates increased signal intensity in the mid-to-lower portion of the central thoracic cord. B, Sagittal contrast-enhanced T1WI demonstrates patchy areas of subtle enhancement.

References

    1. Centers for Disease Control Prevention. West Nile Virus: Statistics, Surveillance and Control. 2003 West Nile Virus Activity in the United States. Available at: www.cdc.gov/ncidod/dvbid/westnile/surv&controlCaseCount03_detailed.htm Accessed May 24,2004
    1. Centers for Disease Control and Prevention. Provisional surveillance summary of the West Nile Virus epidemic: United States, January–November 2002. MMWR Morb Mortal Wkly Rep 2002;51:1129–1133 - PubMed
    1. Centers for Disease Control and Prevention. West Nile activity: United States, 2001. MMWR Morb Mortal Wkly Rep 2002;51:497–501 - PubMed
    1. Centers for Disease Control and Prevention. National West Nile Virus Surveillance System, 2000: Final Plan, May 2000, Atlanta, GA . Available at: www.cdc.gov/ncidod/dvbid/westnile/resources/wn_final_plan_2000_05_26_31.pdf. Accessed May2004
    1. Sampathkumar P. West Nile virus: epidemiology, clinical presentation, diagnosis and prevention. Mayo Clin Proc 2003;78:1137–1144 - PMC - PubMed