Clinical Trial
. 2005 Feb;26(2):333-40.

Voxel-based morphometric comparison between early- and late-onset mild Alzheimer's disease and assessment of diagnostic performance of z score images

Affiliations
Clinical Trial

Voxel-based morphometric comparison between early- and late-onset mild Alzheimer's disease and assessment of diagnostic performance of z score images

Kazunari Ishii et al. AJNR Am J Neuroradiol. 2005 Feb.

Abstract

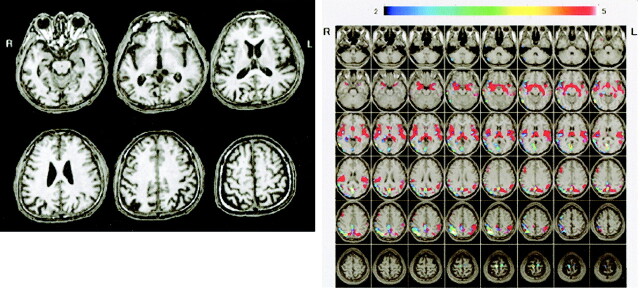
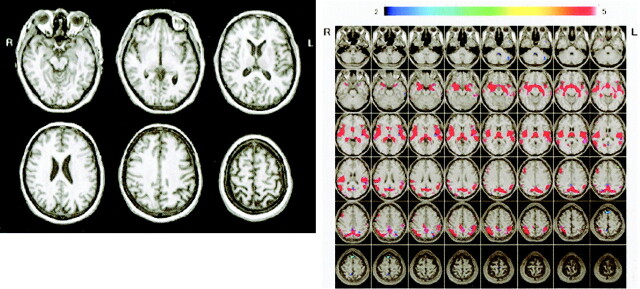
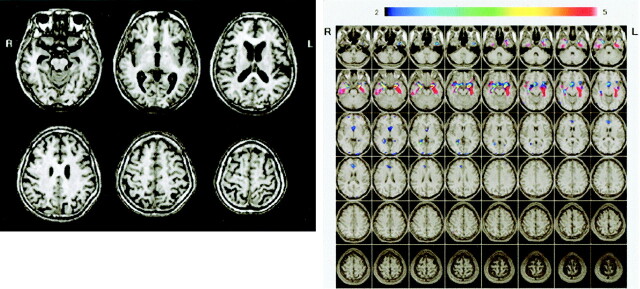
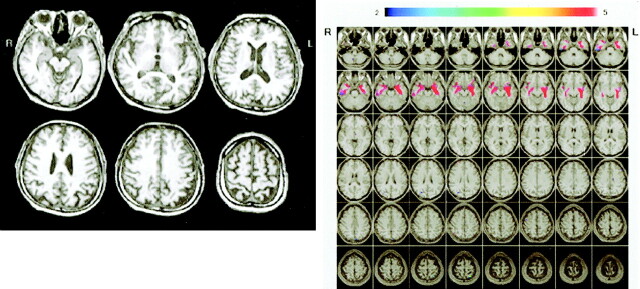
Background and purpose: Voxel-based morphometry (VBM), used for detecting brain atrophy, permits comparison of local gray matter concentration at every voxel in an image between two groups. We sought to delineate the specific patterns of cerebral gray matter loss with regard to onset of Alzheimer's disease (AD) by using MR imaging and VBM and to evaluate the diagnostic performance of VBM with Z score images.

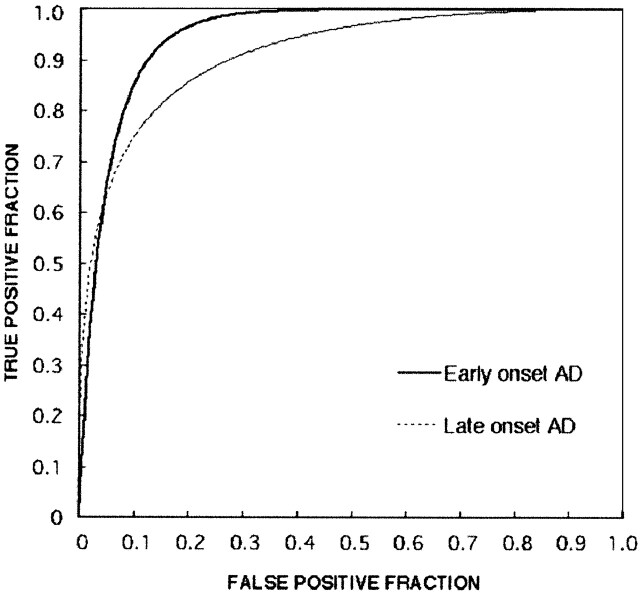
Methods: Two groups of 30 patients with mild AD of different ages of onset were examined. Mean ages in the early- and late-onset groups were 60.2 +/- 5.2 and 71.5 +/- 2.6 years, respectively. Control subjects were aged-matched healthy volunteers. Regions of gray matter loss in early- and late-onset AD were examined with VBM. Diagnostic performance of Z score images obtained with the VBM method was evaluated in patients and control subjects by calculating the area under the receiver operating characteristic curve (A(z)).

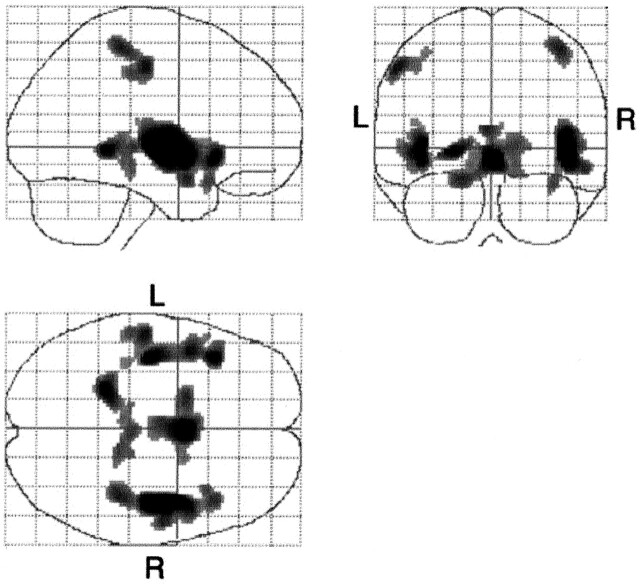
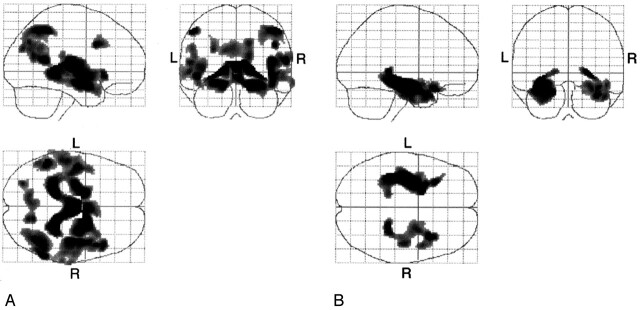
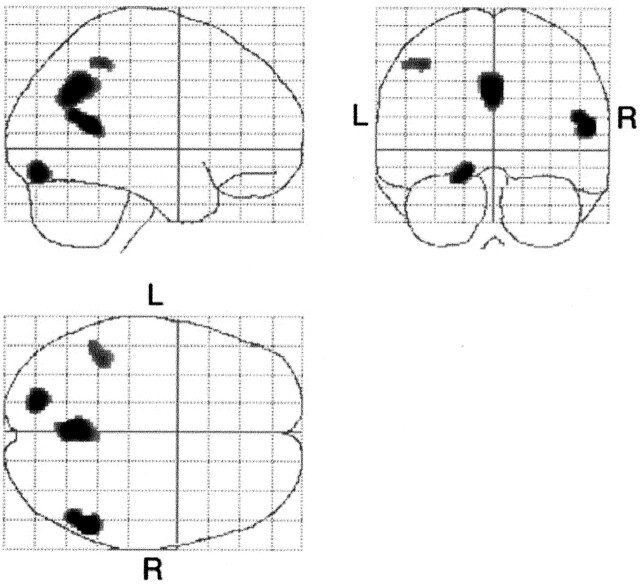
Results: Both AD groups had significantly reduced gray matter in the bilateral medial temporal regions. In addition, the early-onset group had more severe gray matter loss in the bilateral parietal and posterior cingulate cortices and precuneus region. No difference was noted in diagnostic performance of Z score images between the early- (A(z) = 0.9435) and late-onset (A(z) = 0.9018) groups.

Conclusion: Differences were noted in the patterns of regional gray matter loss in patients with early-onset AD versus those with late-onset AD. Parietotemporal and posterior cingulate gray matter loss was found in early-onset AD but not in late-onset AD. Z score images obtained with VBM had a great diagnostic performance for mild AD and can be applied for detecting mild AD in clinical examinations.


Figures

F<sc>ig</sc> 1.
Fig 1.
Statistical parametric maps show specific pixels that indicate a negative correlation between aging and gray matter loss in healthy subjects. The gray matter loss in the hypothalamic region, perisylvian cortices, parahippocampal gyri, and pre- and postcentral gyri are significantly and negatively correlated with age (P < .05, corrected). L indicates left; R, right.
F<sc>ig</sc> 2.
Fig 2.
A, Statistical parametric maps show comparison of patients with early-onset AD with age-matched healthy volunteers (the younger control subjects). Highlighted areas are regions of significant gray matter loss in the patients with early-onset AD compared with age-matched control subjects at a threshold of P < .001, uncorrected. Bilateral medial temporal lobes, inferior parietal lobules, precuneus, and perisylvian cortices and the right inferior frontal gyrus and bilateral cingulate cortex are highlighted. L indicates left; R, right. B, Statistical parametric maps show comparison of patients with late-onset AD and age-matched healthy volunteers (the older control subjects). Highlighted areas are regions of significant gray matter loss in patients with late-onset AD compared with age-matched control subjects at a threshold of P < .001, uncorrected. Bilateral medial temporal cortices are highlighted. L indicates left; R, right.
F<sc>ig</sc> 3.
Fig 3.
Statistical parametric maps show comparison of patients with early-onset AD and those with late-onset AD. Highlighted areas are regions of significant decreased density in patients with early-onset AD compared with those with late-onset AD at a threshold of P < .001, uncorrected. The gray matter densities in the bilateral precuneus, left parietal cortex, right middle temporal gyrus, and left fusiform gyrus were lower in the early-onset group than in the late-onset group. L indicates left; R, right.
F<sc>ig</sc> 4.
Fig 4.
ROC curves for patients with AD versus healthy subjects in the younger and older groups. Note the great differences in diagnostic performance between the younger and older groups. The Az value (0.94359) for early-onset AD was larger than that for late-onset AD (Az = 0.9018). True-positive fraction indicates sensitivity; false-positive fraction, 1 − specificity.
F<sc>ig</sc> 5.
Fig 5.
A and B, Conventional MR images (A) and Z score images (B) obtained in a 54-year-old patient with early-onset AD (MMSE score = 23). Mild right parietal lobular atrophy can be detected by visual inspection of the conventional T1-weighted images; however, the degree of atrophy was not estimated. By using the Z score map, the region and degree of atrophy can be detected easily, enabling this case to be diagnosed as AD. Areas with Z scores greater than 2 (indicated by rainbow color scale) in this subject were overlaid on the prototypic early-onset AD template map (overlaid on normal MR images with red area). L indicates left; R, right.
F<sc>ig</sc> 6.
Fig 6.
A and B, Conventional MR images (A) and Z score images (B) obtained in a 57-year-old healthy subject (MMSE score = 30). No atrophy is apparent on the MR images, and there are no areas with Z score greater than 2 overlaid on the prototypic early-onset AD template map. L indicates left; R, right.
F<sc>ig</sc> 7.
Fig 7.
A and B, Conventional MR images (A) and Z score images (B) obtained in a 73-year-old patient with late-onset AD (MMSE score = 23). Medial temporal atrophy can be detected by visual inspection of the conventional T1-weighted images. By using the Z score map, the region and degree of atrophy can be detected easily; note that the left hippocampal atrophy is stronger than the right. L indicates left; R, right.
F<sc>ig</sc> 8.
Fig 8.
A and B, Conventional MR images (A) and Z score images (B) in a 73-year-old healthy control subject (MMSE score = 30). The left parietal lobe seems to be atrophied on the conventional T1-weighted images, although the Z score map demonstrates that there is no significantly atrophied area

References

    1. Seltzer B, Sherwin I. A comparison of clinical features in early- and late-onset primary degenerative dementia: one entity or two? Arch Neurol 1983;40:143–146 - PubMed
    1. Iversen LL. Differences between early and late-onset Alzheimer’s disease. Neurobiol Aging 1987;8:554–555 - PubMed
    1. Armstrong RA, Nochlin D, Bird TD. Neuropathological heterogeneity in Alzheimer’s disease: a study of 80 cases using principal components analysis. Neuropathology 2000;20:31–37 - PubMed
    1. Mielke R, Herholz K, Grond M, Kessler J, Heiss WD. Differences of regional cerebral glucose metabolism between presenile and senile dementia of Alzheimer type. Neurobiol Aging 1992;13:93–98 - PubMed
    1. Caffarra P, Scaglioni A, Malvezzi L, Previdi P, Spreafico L, Salmaso D. Age at onset and SPECT imaging in Alzheimer’s disease. Dementia 1993;4:342–346 - PubMed