

Case Reports
Cerebral cortical and white matter lesions in chronic hepatic encephalopathy: MR-pathologic correlations
Affiliations
- PMID: 15709133
- PMCID: PMC7974098
Item in Clipboard
Case Reports
Cerebral cortical and white matter lesions in chronic hepatic encephalopathy: MR-pathologic correlations
AJNR Am J Neuroradiol.
2005 Feb.
Abstract
We correlated MR images with histologic findings in two autopsy-proven cases of chronic hepatic encephalopathy. Cortical hyperintensities on T2-weighted images histologically revealed pseudolaminar spongy degeneration in the deep layers of the cerebral cortices and hyperintensities in the cerebral white matters showed tissue rarefaction associated with loss of myelin and axons but without reactive astrocytosis. Both lesions were considered to be caused by chronic hepatic encephalopathy.
Figures
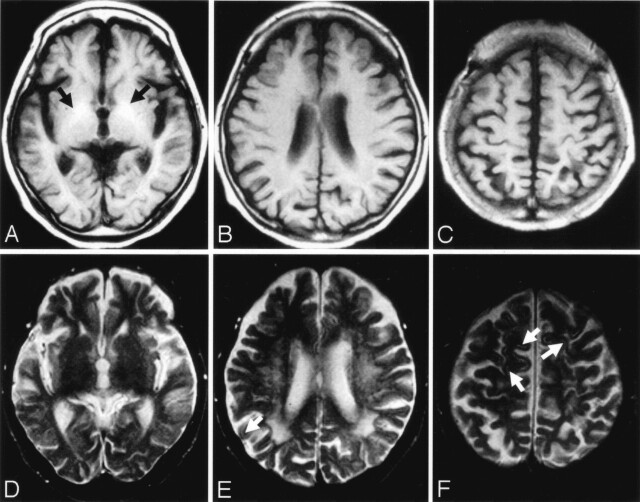
Case 1. A–C, Axial T1-weighted MR images obtained 2 days after admission. T1-weighted image (A) shows hyperintensities in the globus pallidus on both sides (arrows). T1-weighted images show no definite signal intensity changes in the cerebral cortices (A–C). D–F, T2-weighted MR images obtained 2 days after admission. Signal intensity abnormalities are difficult to discern on T2-weighted image (D). T2-weighted images (E and F) show focal, faint hyperintensities in the cerebral cortices (arrows). Confluent and diffuse T2 hyperintensities are seen in the deep and subcortical cerebral white matters (E). G and H, Postmortem axial T2-weighted MR images show deep cortical and subcortical laminar hyperintensities in the entire cerebral hemisphere. Diffuse T2 hypertensities are seen in the deep and subcortical cerebral white matters (G). I and J, Coronal T2-weighted MR images show deep cortical and subcortical laminar hyperintensities in the entire cerebral hemisphere. Hyperintensities are also seen in the deep and subcortical white matters (J). Boxed area in panel I shows hyperintensities in the deep layers of the cerebral cortices and subcortical white matters (open arrows) as well as deep cerebral white matter. The boundary between deep layers of the cerebral cortex and subcortical white matter is not clear. K, The hematoxylin and eosin stained section corresponding to panel J shows laminar pallor of the deep layers of the cerebral cortex (arrowheads) and laminar pallor of the underlying U-fibers (arrows), as well as moderate pallor of the deep cerebral white matter. (Hematoxylin and eosin stain ×100.) L, Histologic findings of the arrowhead area in panel K shows spongy changes of the neuropil, pyknotic, and shrunken neurons (arrowheads) and Alzheimer type II astrocytes (arrows), which have large pale nuclei with marginated chromatin and scanty cytoplasms. (Hematoxylin and eosin stain ×100.) M and N, Histologic findings of the U-fibers (K, arrows) show tissue rarefaction and severe loss of myelin (M) and axons (N). (M, Klüver-Barrera stain ×100; N, Bielschowsky stain ×100.) O and P, Histologic findings of the circled area in panels J and K reveals moderate loss of myelin (O) and axons (P). (O, Klüver-Barrera stain ×100; P, Bielschowsky stain ×100.)

Case 1. A–C, Axial T1-weighted MR images obtained 2 days after admission. T1-weighted image (A) shows hyperintensities in the globus pallidus on both sides (arrows). T1-weighted images show no definite signal intensity changes in the cerebral cortices (A–C). D–F, T2-weighted MR images obtained 2 days after admission. Signal intensity abnormalities are difficult to discern on T2-weighted image (D). T2-weighted images (E and F) show focal, faint hyperintensities in the cerebral cortices (arrows). Confluent and diffuse T2 hyperintensities are seen in the deep and subcortical cerebral white matters (E). G and H, Postmortem axial T2-weighted MR images show deep cortical and subcortical laminar hyperintensities in the entire cerebral hemisphere. Diffuse T2 hypertensities are seen in the deep and subcortical cerebral white matters (G). I and J, Coronal T2-weighted MR images show deep cortical and subcortical laminar hyperintensities in the entire cerebral hemisphere. Hyperintensities are also seen in the deep and subcortical white matters (J). Boxed area in panel I shows hyperintensities in the deep layers of the cerebral cortices and subcortical white matters (open arrows) as well as deep cerebral white matter. The boundary between deep layers of the cerebral cortex and subcortical white matter is not clear. K, The hematoxylin and eosin stained section corresponding to panel J shows laminar pallor of the deep layers of the cerebral cortex (arrowheads) and laminar pallor of the underlying U-fibers (arrows), as well as moderate pallor of the deep cerebral white matter. (Hematoxylin and eosin stain ×100.) L, Histologic findings of the arrowhead area in panel K shows spongy changes of the neuropil, pyknotic, and shrunken neurons (arrowheads) and Alzheimer type II astrocytes (arrows), which have large pale nuclei with marginated chromatin and scanty cytoplasms. (Hematoxylin and eosin stain ×100.) M and N, Histologic findings of the U-fibers (K, arrows) show tissue rarefaction and severe loss of myelin (M) and axons (N). (M, Klüver-Barrera stain ×100; N, Bielschowsky stain ×100.) O and P, Histologic findings of the circled area in panels J and K reveals moderate loss of myelin (O) and axons (P). (O, Klüver-Barrera stain ×100; P, Bielschowsky stain ×100.)

Case 2. A–C, Postmortem axial (A and B) and coronal (C) T2-weighted MR images show cortical laminar hyperintensities in the frontal lobes (B and C, arrows). Hyperintensities are also seen in the deep and subcortical white matters. D, Boxed area in panel C shows laminar hyperintensities in the deep layers of the cerebral cortex (arrowheads). E, The hematoxylin and eosin-stained section corresponding to panel D shows laminar pallor of the deep layers of the cerebral cortex (arrowheads). U-fibers are well preserved in this case (D and E, arrows). F, Histologic findings of the arrowhead area panel E shows spongy changes of the neuropil, pyknotic, and shrunken neurons (arrowheads) and Alzheimer type II astrocytes (arrows). (Hematoxylin and eosin ×100.)
References
-
- Rothstein JD, Herlong HF. Neurologic manifestations of hepatic disease. Neurol Clin 1989;7:563–578 - PubMed
-
- Victor M, Adams RD, Cole M. The acquired (non-Wilsonian) type of chronic hepatocerebral degeneration. Medicine (Baltimore)1965;44:345–396 - PubMed
-
- Butterworth RF, Giguere JF, Michaud J, et al. Ammonia: key factor in the pathogenesis of hepatic encephalopathy. Neurochem Pathol 1987;6:1–12 - PubMed
-
- Hazell AS, Butterworth RF. Hepatic encephalopathy: an update of pathophysiologic mechanisms. Proc Soc Exp Biol Med 1999;222:99–112 - PubMed
Publication types
MeSH terms
LinkOut - more resources
Full Text Sources
Medical