. 2005 Feb;137(2):475-91.
doi: 10.1104/pp.104.054155.

Genome-wide annotation and expression profiling of cell cycle regulatory genes in Chlamydomonas reinhardtii

Affiliations

Genome-wide annotation and expression profiling of cell cycle regulatory genes in Chlamydomonas reinhardtii

Katerina Bisova et al. Plant Physiol. 2005 Feb.

Abstract

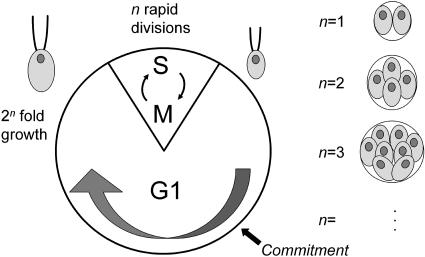
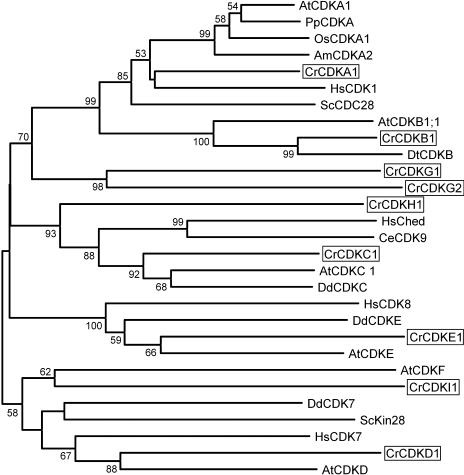
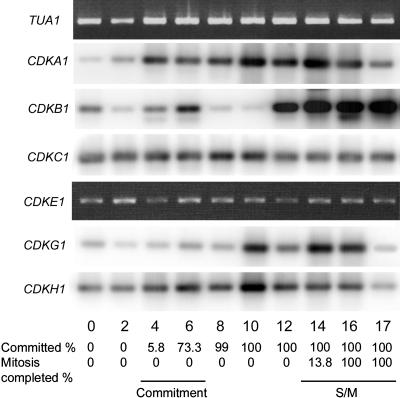
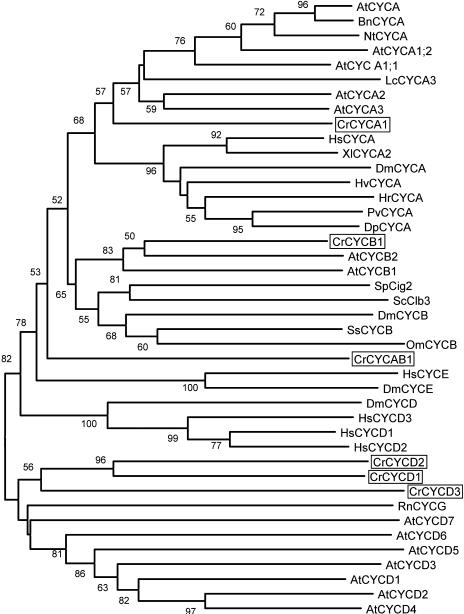
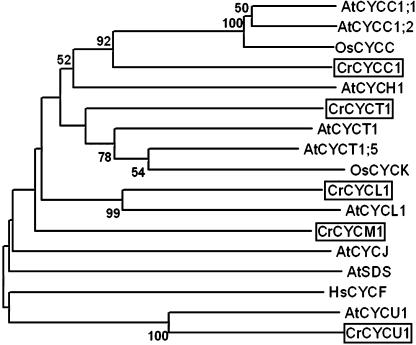
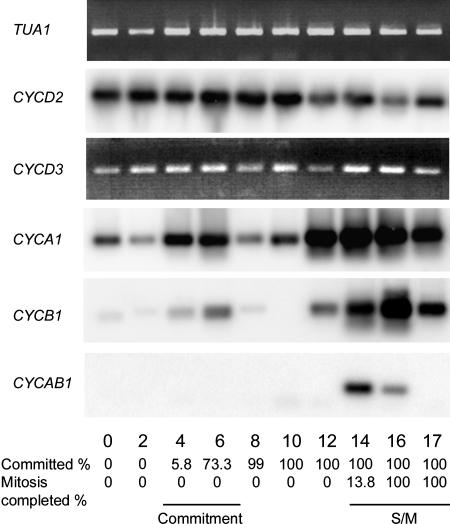
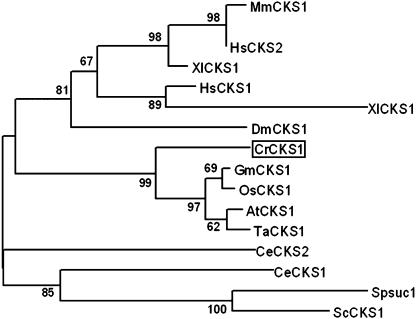
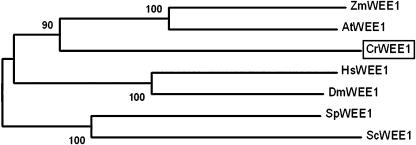
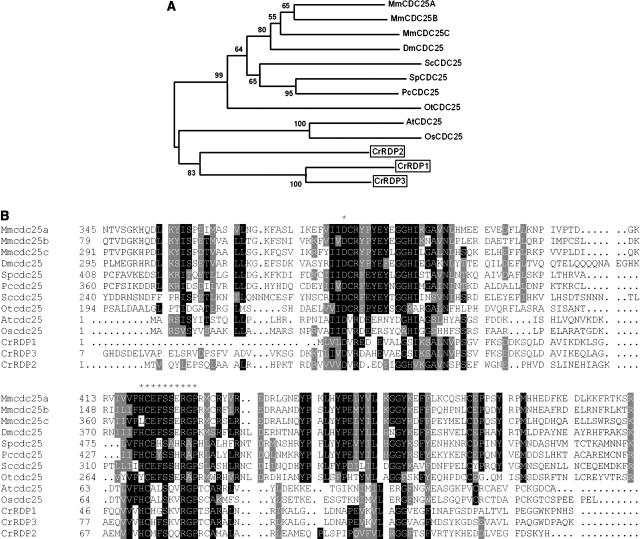
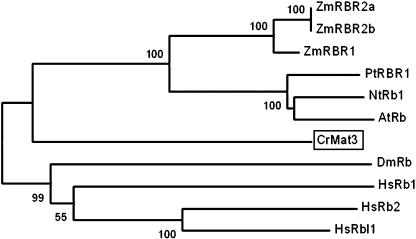
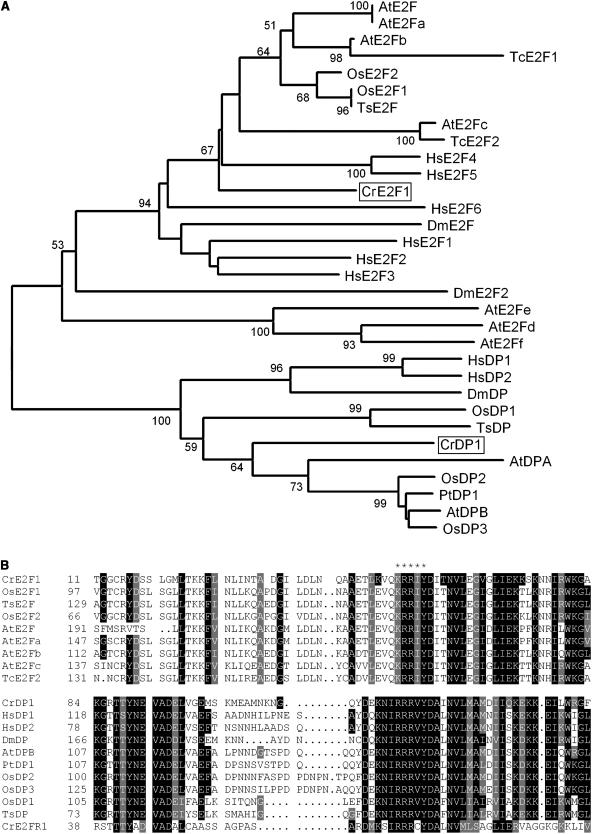
Eukaryotic cell cycles are driven by a set of regulators that have undergone lineage-specific gene loss, duplication, or divergence in different taxa. It is not known to what extent these genomic processes contribute to differences in cell cycle regulatory programs and cell division mechanisms among different taxonomic groups. We have undertaken a genome-wide characterization of the cell cycle genes encoded by Chlamydomonas reinhardtii, a unicellular eukaryote that is part of the green algal/land plant clade. Although Chlamydomonas cells divide by a noncanonical mechanism termed multiple fission, the cell cycle regulatory proteins from Chlamydomonas are remarkably similar to those found in higher plants and metazoans, including the proteins of the RB-E2F pathway that are absent in the fungal kingdom. Unlike in higher plants and vertebrates where cell cycle regulatory genes have undergone extensive duplication, most of the cell cycle regulators in Chlamydomonas have not. The relatively small number of cell cycle genes and growing molecular genetic toolkit position Chlamydomonas to become an important model for higher plant and metazoan cell cycles.


Figures

Figure 1.
Figure 1.
Diagram of the multiple fission cell cycle. A clock-type diagram depicts the phases of the Chlamydomonas cell cycle. Most of the cycle is spent in G1, which is divided into two periods demarcated by the Commitment point (see text for details). At the end of G1, a rapid series of alternating S and M cycles generates 2n daughter cells of uniform size. The value of n is variable and is related to mother cell size. Postmitotic mother cells with different values of n are depicted to the right with 2, 4, 8, etc., daughters.
Figure 2.
Figure 2.
Synchronization of the cell cycle with alternating light and dark periods. A, Photomicrographs of cells at different time points with a scale bar in the bottom left corresponding to 10 μm. B, Graph of synchronized cultures. The top image depicts cell size (white squares). The bottom image depicts the fraction of cells that have passed Commitment (white circles), and progression through cell division with mother cells that have undergone one (black circles), two (black triangles), and three (black squares) rounds of division. Division was complete by 17 h with approximately 60% of the cells dividing three times into eight daughters and approximately 40% dividing twice into four daughters. The light-dark phasing is indicated by the white or black bars above the graphs. C, CKS1-purified histone H1 kinase activity assayed from extracts prepared at different time points. Each image shows an autoradiograph indicating the extent of histone H1 phosphorylation in the presence and absence of the CKI roscovitine.
Figure 3.
Figure 3.
Neighbor-joining tree of CDKs. Bootstrap values of 50% or higher are shown for each clade. Am, Antirrhinum majus; At, Arabidopsis; Cr, C. reinhardtii; Ce, Caenorhabditis elegans; Dd, Dictyostelium discoideum; Dt, Dunaliella tertiolecta; Hs, Homo sapiens; Os, Oryza sativa; Sc, budding yeast; Sp, fission yeast; Pp, Physcomitrella patens. See Supplemental Table II for GenBank accession numbers.
Figure 4.
Figure 4.
Expression of Chlamydomonas CDK homologs. RT-PCR products were detected by Southern blotting (CDKA1, B1, C1, G1, H1) or ethidium bromide staining (CDKE1). Fraction of cells that had passed Commitment and completed cell division when the sample was prepared is indicated at the bottom. α-Tubulin transcript (TUA1) detected by ethidium bromide staining serves as an internal control.
Figure 5.
Figure 5.
Neighbor-joining tree of A-, B-, and D-cyclin groups. Bootstrap values of 50% or higher are shown for each clade. At, Arabidopsis; Cr, C. reinhardtii; Bn, Brassica napus; Dp, Dreissena polymorpha; Dm, Drosophila melanogaster; Hv, Hydra viridis; Hr, Helobdella robusta; Hs, Homo sapiens; Lc, Lycopersicon esculentum; Nt, Nicotiana tabacum; Om, Oncorhynchus mykiss; Os, Oryza sativa; Pv, Patella vulgata; Rn, Rattus norvegicus; Sc, budding yeast; Sp, fission yeast; Ss, Spisula solidissima; Xl, Xenopus laevis. See Supplemental Table II for GenBank accession numbers.
Figure 6.
Figure 6.
Neighbor-joining tree of divergent cyclin groups (C, H, L, T, J, F, U, SDS). Bootstrap values of 50% or higher are shown for each clade. At, Arabidopsis; Cr, Chlamydomonas reinhardtii; Hs, Homo sapiens; Os, Oryza sativa. See Supplemental Table II for GenBank accession numbers.
Figure 7.
Figure 7.
Expression of Chlamydomonas cyclins. RT-PCR products were detected by Southern blotting (CYCD2, A1, B1, AB1) or ethidium bromide staining (CYCD3). Fraction of cells that had passed Commitment and completed cell division when the sample was prepared is indicated at the bottom. α-Tubulin transcript (TUA1) detected by ethidium bromide staining serves as an internal control.
Figure 8.
Figure 8.
Neighbor-joining tree of CKS1 homologs. Bootstrap values of 50% or higher are shown for each clade. At, Arabidopsis; Cr, Chlamydomonas reinhardtii; Ce, Caenorhabditis elegans; Dm, Drosophila melanogaster; Gm, Glycine max; Hs, Homo sapiens; Mm, Mus musculus; Os, Oryza sativa; Sc, budding yeast; Sp, fission yeast; Ta, Triticum aestivum; Xl, Xenopus laevis. See Supplemental Table II for GenBank accession numbers.
Figure 9.
Figure 9.
Neighbor-joining tree of wee1 kinases. Bootstrap values of 50% or higher are shown for each clade. At, Arabidopsis; Cr, Chlamydomonas reinhardtii; Dm, Drosophila melanogaster; Hs, Homo sapiens; Mm, Mus musculus; Os, Oryza sativa; Sc, budding yeast; Sp, fission yeast; Zm, Zea mays. See Supplemental Table II for GenBank accession numbers.
Figure 10.
Figure 10.
A, Neighbor-joining tree of cdc25 phosphatase. Bootstrap values of 50% or higher are shown for each clade. B, ClustalW alignment of phosphatase domains of Chlamydomonas RDP1, 2, 3 with CDC25 from different organisms. Conserved residues are shaded; asterisks indicate position of catalytic site (HCXXSSSRGP) and conserved Asp residue. At, Arabidopsis; Cr, Chlamydomonas reinhardtii; Dm, Drosophila melanogaster; Mm, Mus musculus; Os, Oryza sativa; Ot, Ostreococcus tauri, Pc, Pneumocystis carinii; Sc, budding yeast; Sp, fission yeast. See Supplemental Table II for GenBank accession numbers.
Figure 11.
Figure 11.
Neighbor-joining tree of RB and RBR proteins. Bootstrap values of 50% or higher are shown for each clade. At, Arabidopsis; Cr, Chlamydomonas reinhardtii; Dm, Drosophila melanogaster; Hs, Homo sapiens; Mm, Mus musculus; Nt, Nicotiana tabacum; Pt, Populus tremula × Populus tremuloides; Zm, Zea mays. See Supplemental Table II for GenBank accession numbers.
Figure 12.
Figure 12.
A, Neighbor-joining tree of E2F and DP families. Bootstrap values of 50% or higher are shown for each clade. B, ClustalW alignment of DNA-binding domains of Chlamydomonas E2F/DP with E2F/DP from different organisms. Conserved residues are shaded; asterisks indicate position of DNA-binding motif. At, Arabidopsis; Cr, Chlamydomonas reinhardtii; Dm, Drosophila melanogaster; Hs, Homo sapiens; Os, Oryza sativa; Pt, Populus tremula × Populus tremuloides; Tc, Thlaspi caerulescens; Ts, Triticum sp. See Supplemental Table II for GenBank accession numbers.
Figure 13.
Figure 13.
Expression of Chlamydomonas CKS1, WEE1, MAT3, E2F1, and DP1. RT-PCR products were detected by Southern blotting (WEE1, DP1) or ethidium bromide staining (CKS1, MAT3, E2F1). Fraction of cells that had passed Commitment and completed cell division when the sample was prepared is indicated at the bottom. α-Tubulin transcript (TUA1) detected by ethidium bromide staining serves as an internal control.
Figure 14.
Figure 14.
Expression of S-phase genes MCM2, PCNA1, POLD1, RNR1, and POLA4. RT-PCR products were detected by ethidium bromide staining. Fraction of cells that had passed Commitment and completed cell division when the sample was prepared is indicated at the bottom. α-Tubulin transcript (TUA1) detected by ethidium bromide staining serves as an internal control.

References

    1. Abrahams S, Cavet G, Oakenfull EA, Carmichael JP, Shah ZH, Soni R, Murray JAH (2001) A novel and highly divergent Arabidopsis cyclin isolated by complementation in budding yeast. Biochim Biophys Acta 1539: 1–6 - PubMed
    1. Albani D, Mariconti L, Ricagno S, Pitto L, Moroni C, Helin K, Cella R (2000) DcE2F, a functional plant E2F-like transcriptional activator from Daucus carota. J Biol Chem 275: 19258–19267 - PubMed
    1. Azumi Y, Liu D, Zhao D, Li W, Wang G, Hu Y, Ma H (2002) Homolog interaction during meiotic prophase I in Arabidopsis requires the SOLO DANCERS gene encoding a novel cyclin-like protein. EMBO J 21: 3081–3095 - PMC - PubMed
    1. Barroco RM, De Veylder L, Magyar Z, Engler G, Inze D, Mironov V (2003) Novel complexes of cyclin-dependent kinases and a cyclin-like protein from Arabidopsis thaliana with a function unrelated to cell division. Cell Mol Life Sci 60: 401–412 - PMC - PubMed
    1. Bates S, Bonetta L, MacAllan D, Parry D, Holder A, Dickson C, Peters G (1994) CDK6(PLSTIRE) and CDK4 (PSK-J3) are a distinct subset of the cyclin-dependent kinases that associate with cyclin D1. Oncogene 9: 71–79 - PubMed

Publication types

LinkOut - more resources