. 2005 Mar;15(3):421-7.
doi: 10.1101/gr.3256505. Epub 2005 Feb 14.

DIP-chip: rapid and accurate determination of DNA-binding specificity

Affiliations

DIP-chip: rapid and accurate determination of DNA-binding specificity

Xiao Liu et al. Genome Res. 2005 Mar.

Abstract

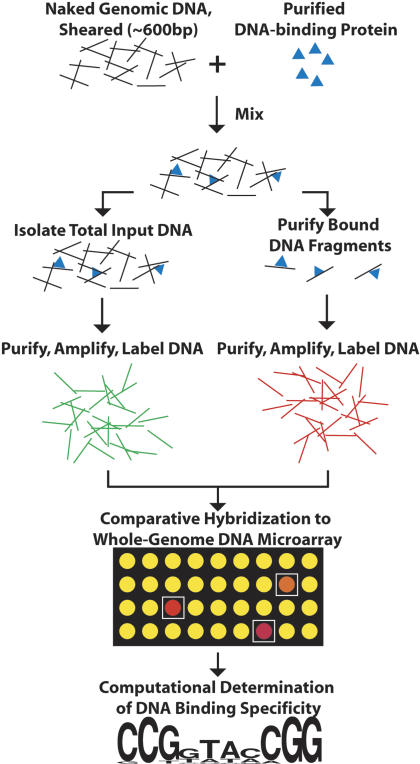
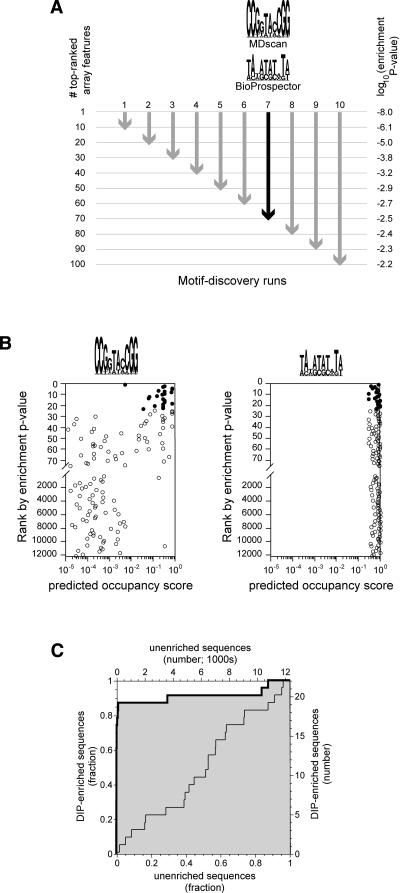
We have developed a new method for determining the DNA-binding specificity of proteins. In DIP-chip (DNA immunoprecipitation with microarray detection), protein.DNA complexes are isolated from an in vitro mixture of purified protein and naked genomic DNA. Whole-genome DNA microarrays are used to identify the protein-bound DNA fragments, and the sequence of the identified fragments is used to derive binding-site descriptions. Using objective criteria for assessing the accuracy of DNA-binding motifs, and using yeast Leu3p as a model, we demonstrate that motifs determined by DIP-chip are as effective at predicting the location of bound proteins in vivo as are motifs determined by conventional low-throughput in vitro methods.


Figures

Figure 1.
Figure 1.
The DIP-ChIP method. A purified DNA-binding protein is incubated with purified, sheared yeast genomic DNA. Protein·DNA complexes are separated from unbound DNA using immunoprecipitation or affinity purification. Purified DNA fragments are amplified, labeled fluorescently, and identified by hybridization to a DNA microarray. Computational methods are then used to define a binding site based on enriched sequences (see text). A detailed description of the DIP-chip experimental methodology is available in the Methods.
Figure 2.
Figure 2.
Motif discovery procedure. (A) For each of the two protein concentrations used, array features were ranked according to enrichment p-value. The sequences corresponding to the top 10, 20, 30,..., 100 features were used as input to BioProspector and MDscan. For each set of features, indicated by arrows, a single position weight matrix (PWM) was obtained from each of the two programs. For illustrative purposes, we show the two motifs discovered using the top 70 features from the 4-nM experiment (black arrow). This set is interesting because it provides a contrast between an excellent PWM (MDscan) and a poor one (Bioprospector, see B and C). Motifs are represented as sequence logos with the height of each column representing the information content of that position in the binding site (Schneider and Stephens 1990). (B) Computationally defined occupancy scores for the top 75 enriched array features and for every 200th feature thereafter (4-nM experiment; note the break in the y-axis and the change in scale). Occupancy scores were calculated using the two PWMs shown in A (Methods). Filled circles represent the 23 features that meet the 1% false discovery rate criterion for significance; all other features are shown as open circles. Only the PWM defined by MDscan (consensus sequence CCGGTACCGG) shows a marked tendency for the DIP-enriched sequences to have higher occupancy scores than the nonenriched sequences. (C) A Receiver Operator Characteristic (ROC) curve (Hanley and McNeil 1982) showing the power of a PWM to distinguish DIP-enriched sequences from nonenriched. The heavy line with the shaded area below is for the PWM defined by MDscan in A, while the light line is for the PWM defined by BioProspector. The curves are equivalent to a plot of the true positives vs. false positives for all possible values of the occupancy scores that, for a given PWM, would be used to predict enrichment (see text). Each of the 20 PWMs discovered at each protein concentration was judged based on the area under the ROC curve (ROC AUC) obtained using occupancy scores calculated with that PWM. A ROC AUC value of 0.5, corresponding to a diagonal ROC curve, is expected by chance, while a value of 1.0 indicates perfect predictive value for the motif. In this case, the BioProspector-defined motif shows no predictive power (ROC AUC = 0.49), while the MDscan motif does (ROC AUC = 0.91). Note that the ability of MDscan to outperform Bioprospector is specific to this example and does not occur in every case.
Figure 3.
Figure 3.
Four representations of Leu3p-binding specificity, derived from the indicated in vitro binding experiments.
Figure 4.
Figure 4.
A comparison of the ability of DNA-binding motifs derived from different in vitro experiments to explain in vivo binding patterns. (A) Receiver Operator Characteristic (ROC) curve for quantitating how well a DIP-chip derived PWM can predict the results of a ChIP-chip experiment. The best PWM defined by the 4-nM DIP-chip data was used to calculate this plot (Methods; Fig. 2). Identical analyses were performed on PWMs derived from SELEX, EMSA, and all DIP-chip PWMs. (B) Areas under the ROC curve for PWMs evaluated against the ChIP data. The 95% confidence interval for the EMSA Kd ROC AUC value was estimated by bootstrap resampling of the occupancy scores and enrichment values for the 22 ChIP-enriched features. For the DIP-chip defined PWMs, the PWM that scored best when evaluated against the DIP data itself is shown as a filled circle. Other PWMs that are within the confidence interval of the best when evaluated against the DIP data are shown as open circles. (C) Same as B, but with a zoomed-in ROC AUC scale.

References

    1. Benjamini, Y. and Hochberg, Y. 1995. Controlling the false discovery rate: A practical and powerful approach to multiple testing. J. R. Stat. Soc. B 57: 289-300.
    1. Bulyk, M.L., Huang, X., Choo, Y., and Church, G.M. 2001. Exploring the DNA-binding specificities of zinc fingers with DNA microarrays. Proc. Natl. Acad. Sci. 98: 7158-7163. - PMC - PubMed
    1. Brachmann, C.B., Davies, A., Cost, G.J., Caputo, E., Li, J., Hieter, P., and Boeke, J.D. 1998. Designer deletion strains derived from Saccharomyces cerevisiae S288C: A useful set of strains and plasmids for PCR-mediated gene disruption and other applications. Yeast 14: 115-132. - PubMed
    1. Clarke, N.D. and Granek, J.A. 2003. Rank order metrics for quantifying the association of sequence features with gene regulation. Bioinformatics 19: 212-218. - PubMed
    1. Efron, B. and Gong, G. 1983. A leisurely look at the bootstrap, the jackknife and cross-validation. J. Amer. Stat. Soc. 37: 36-48.

WEB SITE REFERENCES

    1. http://www.bio.unc.edu/faculty/lieb/labpages/Protocols.shtml; Common microarray protocols.
    1. http://www.yeastgenome.org; Saccharomyces Genome Database.
    1. https://genome.unc.edu; UNC Microarray Database.

Publication types

MeSH terms