. 2005 Mar;15(3):343-51.
doi: 10.1101/gr.3266405. Epub 2005 Feb 14.

Complex genomic rearrangements lead to novel primate gene function

Affiliations

Complex genomic rearrangements lead to novel primate gene function

Francesca D Ciccarelli et al. Genome Res. 2005 Mar.

Abstract

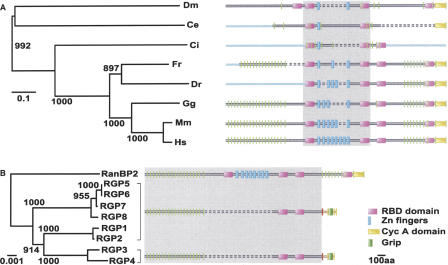
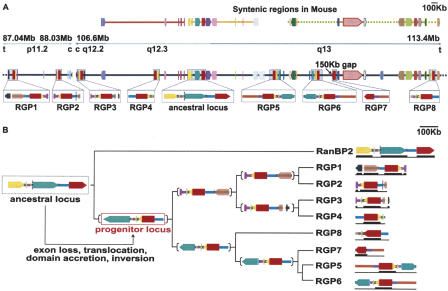
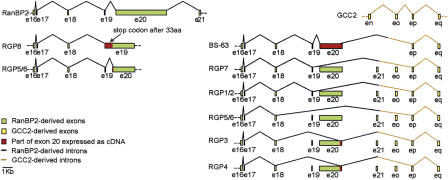
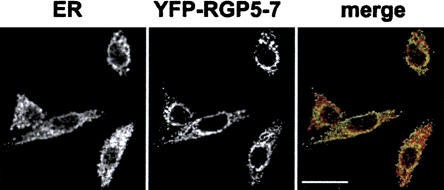
Orthologous genes that maintain a single-copy status in a broad range of species may indicate a selection against gene duplication. If this is the case, then duplicates of such genes that do survive may have escaped the dosage control by rapid and sizable changes in their function. To test this hypothesis and to develop a strategy for the identification of novel gene functions, we have analyzed 22 primate-specific intrachromosomal duplications of genes with a single-copy ortholog in all other completely sequenced metazoans. When comparing this set to genes not exposed to the single-copy status constraint, we observed a higher tendency of the former to modify their gene structure, often through complex genomic rearrangements. The analysis of the most dramatic of these duplications, affecting approximately 10% of human Chromosome 2, enabled a detailed reconstruction of the events leading to the appearance of a novel gene family. The eight members of this family originated from the highly conserved nucleoporin RanBP2 by several genetic rearrangements such as segmental duplications, inversions, translocations, exon loss, and domain accretion. We have experimentally verified that at least one of the newly formed proteins has a cellular localization different from RanBP2's, and we show that positive selection did act on specific domains during evolution.


Figures

Figure 1.
Figure 1.
Conservation of the RanBP2 gene during metazoan evolution and its expansion in human. For each protein, the corresponding domain architecture is reported. The proteins are depicted reproducing the sequence alignments, the dashed bars representing the gaps in the alignments. The regions used to build the trees are highlighted in gray. (A) Phylogenetic tree of the RanBP2 orthologs in representatives of fully sequenced metazoan genomes. The light-blue bars represent protein regions that were not predictable because of gaps in the corresponding genomes. The exon-intron boundaries of the encoding genes are reported as vertical green bars. (Ce) Caenorhabditis elegans; (Ci) Ciona intestinalis; (Dm) Drosophila melanogaster; (Dr) Danio rerio; (Fr) Fugu rubripes; (Gg) Gallus gallus; (Hs) Homo sapiens; (Mm) Mus musculus.(B) Family tree of RanBP2 and RGP genes. The exon-intron boundaries of RanBP2-derived region (exons 1-20) are shown in green, those of GCC2-derived part (exons p-r) are in yellow. The RGP-specific intron, bearing the fusion between the RanBP2- and GCC2-derived regions, is depicted in red. The RGP regions encoded by the RanBP2-derived DNA are shown in black, the ones encoded by the GCC2-derived DNA in brown.
Figure 2.
Figure 2.
Evolutionary mechanism for the origin of the new gene family. The genes are shown as arrows with different colors associated with different genes. (Red) RanBP2; (yellow) GCC2; the RGP paralogs are shown in red for the RanBP2-derived region and in yellow for the GCC2-derived domain. The color scheme of the other genes as well as a larger version of the figure are given in Supplemental Figures S4 and S5, respectively. (A) Gene composition of the regions on human Chromosome 2 where the duplicated fragments containing the RGP paralogs are interspersed. The duplicated segments are highlighted in gray and enlarged in the lower boxes, in which similar intergenic sequences are also reported (see Methods for more details). The vertical dashed bars in both the segments containing RGP2 and RanBP2 indicate intergenic regions with no detectable intrachromosomal matches. The 3′-end of the RGP7 copy could not be assessed, as the human genome build 34 has a 150-kb gap in that region. The chromosomal bands, the region borders, and the direction to the centromere (c) and telomeres (t) are shown in the upper bar. The syntenic regions in mouse Chromosomes 10 (yellow), 17 (orange), and 2 (green) are also shown. (B) Family tree of the RGP and the RanBP2 paralogs, and putative mechanism for the formation of the RGP progenitor locus. At each branching point, the genomic structure of the putative progenitor is depicted. The ancestral locus, which contains RanBP2 and GCC2 and is syntenic in mouse, underwent several genetic rearrangements leading to the formation of the progenitor locus. The rearrangements included an inversion of the entire region, a loss of the 3′-exons from RanBP2, a partial deletion of the RanBP2 exon 20, and a translocation that places the 3′ noncoding region just downstream of the last four exons of the GCC2 duplicated gene. This event leads to the accretion of the GRIP domain. We assume that the progenitor locus already contained the newly formed RGP gene, as all the RGP duplicates contain the GRIP domain and a shorter version of RanBP2-derived exon 20. The bars reported under each of the duplicated segments indicate the presence of unambiguous expression data (ESTs and cDNAs) for the corresponding gene.
Figure 3.
Figure 3.
Gene structure and expression evidences of the RGP gene copies. The gene structure of the regions of the RGP genes amplified by RT-PCR is shown. For comparison, the corresponding regions of the RanBP2 (exons 16-19) and GCC (exons n-q) genes are reported. By comparing the expression data to the genomic sequences, it is possible to predict the existence of different splice variants for each copy. Indeed, some of the cDNAs detect exon-skipping.
Figure 4.
Figure 4.
Subcellular localization of RanBP2L1 isoform 2 (RGP5-7). Confocal images of fixed HeLa cells expressing a GFP-fusion of RANBPL1 isoform 2. Cells were stained with a polyclonal anti-calnexin antibody. In the merged image the calnexin signal is shown in red and the GFP signal is shown in green. Scale bar, 20 μm.

References

    1. Altschul, S.F., Madden, T.L., Schaffer, A.A., Zhang, J., Zhang, Z., Miller, W., and Lipman, D.J. 1997. Gapped BLAST and PSI-BLAST: A new generation of protein database search programs. Nucleic Acids Res. 25: 3389-3402. - PMC - PubMed
    1. Babcock, M., Pavlicek, A., Spiteri, E., Kashork, C.D., Ioshikhes, I., Shaffer, L.G., Jurka, J., and Morrow, B.E. 2003. Shuffling of genes within low-copy repeats on 22q11 (LCR22) by Alu-mediated recombination events during evolution. Genome Res. 13: 2519-2532. - PMC - PubMed
    1. Bailey, J.A., Gu, Z., Clark, R.A., Reinert, K., Samonte, R.V., Schwartz, S., Adams, M.D., Myers, E.W., Li, P.W., and Eichler, E.E. 2002. Recent segmental duplications in the human genome. Science 297: 1003-1007. - PubMed
    1. Bailey, J.A., Liu, G., and Eichler, E.E. 2003. An Alu transposition model for the origin and expansion of human segmental duplications. Am. J. Hum. Genet. 73: 823-834. - PMC - PubMed
    1. Birney, E., Thompson, J.D., and Gibson, T.J. 1996. PairWise and SearchWise: Finding the optimal alignment in a simultaneous comparison of a protein profile against all DNA translation frames. Nucleic Acids Res. 24: 2730-2739. - PMC - PubMed

WEB SITE REFERENCES

    1. http://genome.ucsc.edu/; University of California San Francisco genome browser.
    1. http://www.ensembl.org/; Ensembl.
    1. http://www.bork.embl.de/~ciccarel/RGP_add_data.html; Supplemental material to this paper.
    1. http://abacus.gene.ucl.ac.uk/software/paml.html/; PAML.
    1. http://smart.embl-heidelberg.de/; SMART database.

LinkOut - more resources