. 2005 Feb 22;102(8):3099-104.
doi: 10.1073/pnas.0500059102. Epub 2005 Feb 14.

Ca2+ blinks: rapid nanoscopic store calcium signaling

Affiliations

Ca2+ blinks: rapid nanoscopic store calcium signaling

Didier X P Brochet et al. Proc Natl Acad Sci U S A. .

Abstract

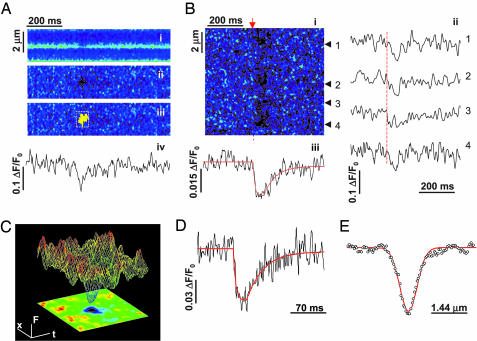
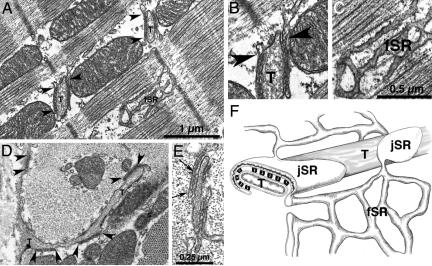
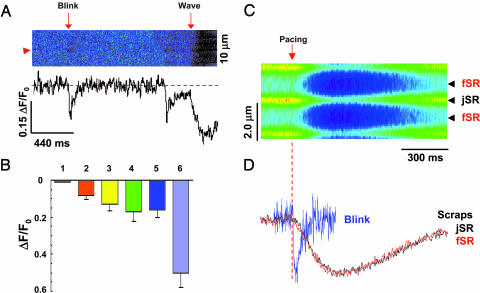
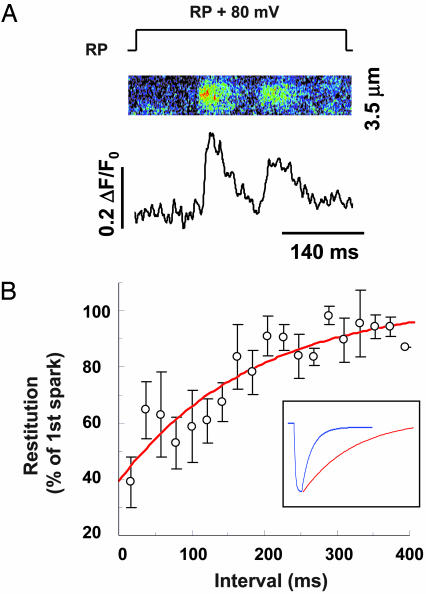
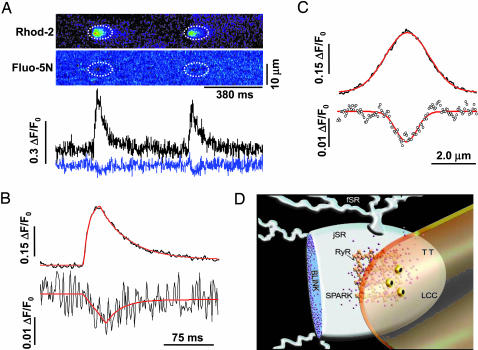
Luminal Ca(2+) in the endoplasmic and sarcoplasmic reticulum (ER/SR) plays an important role in regulating vital biological processes, including store-operated capacitative Ca(2+) entry, Ca(2+)-induced Ca(2+) release, and ER/SR stress-mediated cell death. We report rapid and substantial decreases in luminal [Ca(2+)], called "Ca(2+) blinks," within nanometer-sized stores (the junctional cisternae of the SR) during elementary Ca(2+) release events in heart cells. Blinks mirror small local increases in cytoplasmic Ca(2+),orCa(2+) sparks, but changes of [Ca(2+)] in the connected free SR network were below detection. Store microanatomy suggests that diffusional strictures may account for this paradox. Surprisingly, the nadir of the store depletion trails the peak of the spark by about 10 ms, and the refilling of local store occurs with a rate constant of 35 s(-1), which is approximately 6-fold faster than the recovery of local Ca(2+) release after a spark. These data suggest that both local store depletion and some time-dependent inhibitory mechanism contribute to spark termination and refractoriness. Visualization of local store Ca(2+) signaling thus broadens our understanding of cardiac store Ca(2+) regulation and function and opens the possibility for local regulation of diverse store-dependent functions.


Figures

Fig. 2.
Fig. 2.
Ca2+ blink: nanoscopic store Ca2+ depletion. (A)Ca2+ blinks. (i) Raw linescan image of SR Ca2+ with intra-SR indicator fluo-5N. The brief darkening shows a spontaneous jSR Ca2+ release event, a blink. (ii) Normalized image (F/F0, to correct for the nonuniform indicator staining). (iii) Computer-aided automated detection of blinks. (iv) Time course of normalized blink from top. (B) Excitation-activated blinks (arrow). (i) Normalized linescan image showing four blink events. (ii) Time courses of blink events (arrowheads). (iii) Average time course with nonlinear fit (smooth curve; ΔF/F0 = -0.03, time to nadir tnadir = 29 ms, τrecovery = 31 ms). 1 μM nifedipine. (C) Surface plot of averaged blink (upper) with linescan image (lower) (n = 7). (D) Temporal characteristics of a blink (averaged: 36 spontaneous and 22 evoked events). Fit curve shows ΔF/F0 = -0.06, tnadir = 22 ms, and time constant τrecovery = 33 ms. (E) Spatial profile of the blink from D shows full width at half maximum (FWHM) 739 nm.
Fig. 1.
Fig. 1.
Microanatomy of SR in rabbit cardiac cells. (A) Longitudinal section of rabbit left ventricular myocyte, showing junctional SR (jSR) cisternae near T tubules (T) and free SR (fSR). Arrowheads indicate continuities between jSR and fSR. (B and C) Details from A. Connections between jSR and fSR (arrowheads in B) were seen in 60 of 136 cisterna profiles in 60-nm-thick sections only at the periphery of the flat jSR cisternae. The average number of connections was therefore estimated to be 4.3 for a 592-nm-diameter jSR cisterna. (D) Tangential view of fSR network: Cross section at the level of the Z line. jSR cisternae (bracketed by arrowheads) are apposed either to T tubules (T) or the surface membrane. Profiles of fSR are seen next to a mitochondrion. (E) The cytoplasmic domains of ryanodine receptors (RyRs) are seen as feet in the gap between jSR and T tubule membranes (between arrows). (F) Diagram showing the relationship between the fSR network, the flat jSR cisternae, T tubules, and feet in rabbit ventricle.
Fig. 3.
Fig. 3.
Blinks revealing mechanisms of spark termination. (A) Same-site comparison of jSR depletions in blinks vs. Ca2+ waves. The fractional blink/wave amplitude is 0.61 at the site marked by arrowhead. (B) Statistical analysis of fluo-5N signal (ΔF/F0) for averaged blink from spark–blink pairs (bar 1), individually resolved blinks (bar 2), individual blinks corrected for background contamination (bar 3), full-fledged excitation-evoked release (bar 4), Ca2+ waves (bar 5), and caffeine (10 mM)-elicited Ca2+ release (bar 6). Data are expressed as mean ± SD and n = 6–86. (C) Action potential-elicited store Ca2+ transients or scraps. ΔF/F0 = -0.17 ± 0.05, n = 6. Such [Ca2+] transients correspond to a 65% reduction in the free [Ca2+] and a 38% diminution of the calsequestrin-bound Ca2+ (see Methods). Arrow and dashed line mark the timing of electrical stimulation. (D) Comparison between jSR scraps and blinks. Traces are normalized to the same amplitude. The traces for scraps at jSR and fSR essentially overlap, and the tnadir was 137 ± 44 ms, and the half-recovery time was 194 ± 92 ms (n = 6).
Fig. 4.
Fig. 4.
Time courses of refilling of local Ca2+ store and refractoriness of local Ca2+ release. (A) Typical results of a pair of Ca2+ sparks evoked beneath the patch membrane in response to a 80-mV patch depolarization from the resting potential (RP, approximately -75 mV). Note the reduced amplitude of the succeeding spark. (B) The restitution curve for spark amplitude; 167 pairs of sparks obtained by using the protocol in A were grouped by intervals at 20-ms increments. n = 5–12 at each data point. (Inset) Comparison between the fitted blink time course (blue curve, from Fig. 2D) and the fitted restitution curve (red curve, τ = 187 ms).
Fig. 5.
Fig. 5.
Visualization of complementary spark–blink signal pairs. (A) Simultaneous measurements of sparks and blinks. (Upper) Linescan images of repeated sparks (rhod-2, upper) and blinks (fluo-5N, lower). Dotted ellipses mark corresponding areas in the images. (Lower) Time courses of sparks (black, upper) and blinks (blue, lower). (B) Time courses of the spark (upper) and blink (lower) averaged from 86 event pairs in 9 cells. The fitted smooth curves (red) show sparks (upper) displaying ΔF/F0 = 0.30, tpeak = 21 ms, and τrecovery = 43 ms, and blinks (lower) displaying ΔF/F0 = 0.013, tnadir = 32 ms, and τrecovery = 23 ms. Averaged spark obtained with rhod-2 alone (n = 22 events) displayed ΔF/F0 = 0.41, tpeak = 19 ms, and τrecovery = 31 ms, suggesting that fluo-5N retention in the SR does not alter spark properties. (C) Averaged spatial profiles. Upper: Ca2+ spark (FWHM = 2.2 μm); lower: Ca2+ blink (FWHM = 1.0 μm). (D) Overview of the Ca2+ spark–blink duality with respect to transverse tubule (TT) and SR. LCC, L-type Ca2+ channel..

Similar articles

Cited by

References

    1. Neher, E. (1998) Neuron 20, 389-399. - PubMed
    1. Berridge, M. J., Bootman, M. D. & Roderick, H. L. (2003) Nat. Rev. Mol. Cell Biol. 4, 517-529. - PubMed
    1. Bers, D. M. (2002) Nature 415, 198-205. - PubMed
    1. Clapham, D. E. (1995) Cell 80, 259-268. - PubMed
    1. Berridge, M. J. (2002) Cell Calcium 32, 235-249. - PubMed

Publication types

MeSH terms