Comparative Study
. 2005 Mar;8(3):372-9.
doi: 10.1038/nn1404. Epub 2005 Feb 13.

Receptive field structure varies with layer in the primary visual cortex

Affiliations
Comparative Study

Receptive field structure varies with layer in the primary visual cortex

Luis M Martinez et al. Nat Neurosci. 2005 Mar.

Abstract

Here we ask whether visual response pattern varies with position in the cortical microcircuit by comparing the structure of receptive fields recorded from the different layers of the cat's primary visual cortex. We used whole-cell recording in vivo to show the spatial distribution of visually evoked excitatory and inhibitory inputs and to stain individual neurons. We quantified the distribution of 'On' and 'Off' responses and the presence of spatially opponent excitation and inhibition within the receptive field. The thalamorecipient layers (4 and upper 6) were dominated by simple cells, as defined by two criteria: they had separated On and Off subregions, and they had push-pull responses (in a given subregion, stimuli of the opposite contrast evoked responses of the opposite sign). Other types of response profile correlated with laminar location as well. Thus, connections unique to each visual cortical layer are likely to serve distinct functions.


Figures

Figure 1
Figure 1
Receptive fields with a push-pull arrangement of synaptic inputs. (ad) Receptive fields of a thalamocortical neuron in the lateral geniculate nucleus (a), two spiny cells (b,d) and a smooth cell (c), all in layer 4. The receptive fields are shown as arrays of trace pairs in which each position in the stimulus grid is represented by averages of the corresponding responses to dark (black traces) and bright (gray traces) squares. The boundaries of On (red) and Off (blue) subregions are approximated by dashed circles or ovals. In all panels, stimuli of the reverse contrast evoked responses of the opposite sign (push-pull) in each subregion. The small vertical dashes indicate the onset of the stimulus, which was flashed for 31 or 47 ms; stimulus size was 0.85° or 1.7° and grid spacing was 0.85° (that is, each square in the array represents 0.85° of visual angle).
Figure 2
Figure 2
Receptive fields with push-push or push-null configurations. (ac) Receptive fields of a spiny stellate cell (a) and a smooth cell (c) in layer 4, a pyramidal cell in layers 2+3 (b) and a pyramidal cell in lower layer 6 (d); conventions as for Figure 1. Excitation to bright and dark stimuli was spatially overlapping (push-push) in the receptive fields from layer 4 (a,c). Outside layer 4, cells rarely responded to both polarities of the stimulus, so receptive fields often had just one subregion (push-null) (b,d) or could not be mapped with the sparse noise (not shown). Stimulus size was 0.85° or 1.7° and grid spacing was 0.85°.
Figure 3
Figure 3
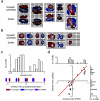
The spatial arrangement of On and Off subregions in cortical receptive fields. (a,b) Contour plots of the receptive fields of five simple (a) and four complex cells (b) compare maps constructed from synaptic potentials to those made from spikes. For simple cells, On (red) and Off (blue) responses are shown in the same plot, and for complex cells, maps of On and Off responses are shown in separate panels. Each contour was smoothed and represents a 10% decrement relative to the peak (brightest) value; the maps were thresholded by 10%. The responses constructed from spikes were normalized separately from those made from synaptic potentials. Stimulus size was 0.85° or 1.7° and grid spacing was 0.85° (that is, the space between each line on the overlay is 0.85°). Overlap index values for simple cells from left to right were (synaptic potentials and spikes, respectively) −0.20, −0.34; 0.07, −0.08; −0.16, −0.29; −0.22, −0.82; −0.18, −0.04. For complex cells, they were 0.80, 0.53; 0.79, 0.76; 0.82, 0.66; 1 polarity, 1 polarity. (c) Histogram showing the distribution of values of overlap index (bin size = 0.1) for the entire population with a graphical explanation of the index below. Only cells that responded to both polarities of the stimulus were included. The distribution of values was not unimodal (probability of rejection 0.99, Hartigan's dip test). (d) The histograms at top and right show index values for synaptic excitation (as in a) and spikes (as in b), respectively. The central scatter plot compares the two sets of values for each cell; the red line indicates unit slope.
Figure 4
Figure 4
Excitation and inhibition within single subregions of the receptive field. (a) Histogram of absolute values of the push-pull index (bin size = 0.1) with a graphical explanation of the index below. Filled bars, cells with segregated On and Off subregions (overlap index ≤0.09); open bars, cells with overlapping On and Off subfields (overlap index >0.3) or with just one subregion; NR indicates that there was no response to the flash stimulus. The asterisk marks a pyramid in layer 2+3 whose dendrites extended into layer 4 and whose receptive field had push-pull in only one of two subregions. The distribution of values was not unimodal, probability of rejection 0.99 (Hartigan's dip test). (b) Comparison of values of push-pull index for thalamic receptive fields (gray) and simple cortical receptive fields with segregated On and Off subregions (black); bin size = 0.1. (c) Overlap index values of excitatory and inhibitory responses to stimuli of the opposite contrast in thalamic receptive field centers (gray) and in the individual subfields of cortical cells with separated subregions (black); bin size = 0.1.
Figure 5
Figure 5
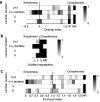
Correlation between receptive field structure and cortical layer. (ac) Histograms show the distribution of values for the overlap index (a), number of subregions (b) and push-pull index (c) in the different cortical layers. 1P indicates cells that responded to only one polarity of the sparse noise, and NR denotes cells that did not respond to the static stimulus at all; bin size was 0.1 in a and c. In each histogram, for each layer, the bin with the greatest number of cells is shaded black, and the gray level in the remaining bins is normalized to that maximum. For b, the bins are labeled by the number (2 or 3) of separated On and Off subregions; 0 includes cells with overlapped On and Off subregions and those that responded to only one stimulus polarity; asterisk same as for Figure 4.
Figure 6
Figure 6
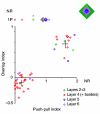
Comparison of subregion overlap and push-pull. A scatter plot of subregion overlap versus push-pull; the results are color coded for layer. The points above the plot show push-pull index values for cells that responded to only one polarity of the stimulus (1P); the label NR indicates cells (upper right) that did not respond to the sparse noise. The intersection of the crosses in each cluster of points corresponds to the mean, and the length of each line to the 95% confidence intervals (calculated with a bootstrap method). Concentric symbols are used when multiple cells shared the same coordinate; asterisk as for Figure 4.
Figure 7
Figure 7
Laminar distribution of receptive fields with push-pull. Receptive fields with a push-pull organization were found in layer 4, its borders or in upper layer 6, with one exception: a pyramid in layer 2+3 with dendrites extending into layer 4. The receptive fields are ordered from left to right according to depth of the soma. All but three of the receptive fields with push-pull had ≥2 subregions; On and Off subregions are red and blue, respectively, and asterisks indicate cells with only one obvious subregion. The scale bar (5°) indicates the size of the receptive fields.
Figure 8
Figure 8
Morphology and receptive field structure. (a,b) The figure shows a sample of our three-dimensional reconstructions taken from the simple cell (a) and complex cell (b) populations. The figure shows coronal views (from left to right, top) of a pyramid in upper layer 6, a pyramid at the 4–5 border, a spiny stellate cell in layer 4, a smooth cell in layer 4 and a pyramid at the 3–4 border; and (from left to right, bottom) of a pyramid in mid layer 6, a pyramid in layer 5, two pyramids in the superficial layers; a basket cell in layer 4 and a spiny stellate cell in the same layer. Cell bodies and dendritic arbors are gray, and axons are black.

Comment in

Similar articles

Cited by

References

    1. Callaway EM. Local circuits in primary visual cortex of the macaque monkey. Annu. Rev. Neurosci. 1998;21:47–74. - PubMed
    1. Fitzpatrick D. The functional organization of local circuits in visual cortex: insights from the study of tree shrew striate cortex. Cereb. Cortex. 1996;6:329–341. - PubMed
    1. Lund JS, Henry GH, MacQueen CL, Harvey AR. Anatomical organization of the primary visual cortex (area 17) of the cat. A comparison with area 17 of the macaque monkey. J. Comp. Neurol. 1979;184:599–618. - PubMed
    1. Binzegger T, Douglas RJ, Martin KA. A quantitative map of the circuit of cat primary visual cortex. J. Neurosci. 2004;24:8441–8453. - PMC - PubMed
    1. Brecht M, Roth A, Sakmann B. Dynamic receptive fields of reconstructed pyramidal cells in layers 3 and 2 of rat somatosensory barrel cortex. J. Physiol. (Lond.) 2003;553:243–265. - PMC - PubMed

Publication types

MeSH terms