. 2005 Mar;25(5):1596-607.
doi: 10.1128/MCB.25.5.1596-1607.2005.

Phosphoinositide 3-kinase catalytic subunit deletion and regulatory subunit deletion have opposite effects on insulin sensitivity in mice

Affiliations

Phosphoinositide 3-kinase catalytic subunit deletion and regulatory subunit deletion have opposite effects on insulin sensitivity in mice

Saskia M Brachmann et al. Mol Cell Biol. 2005 Mar.

Abstract

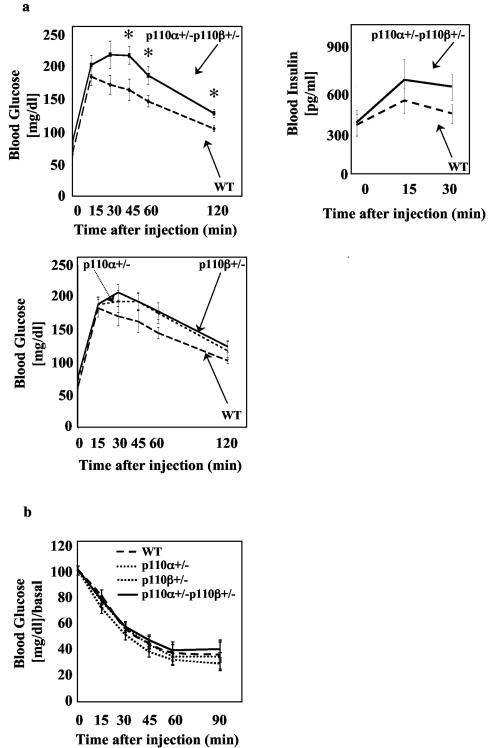
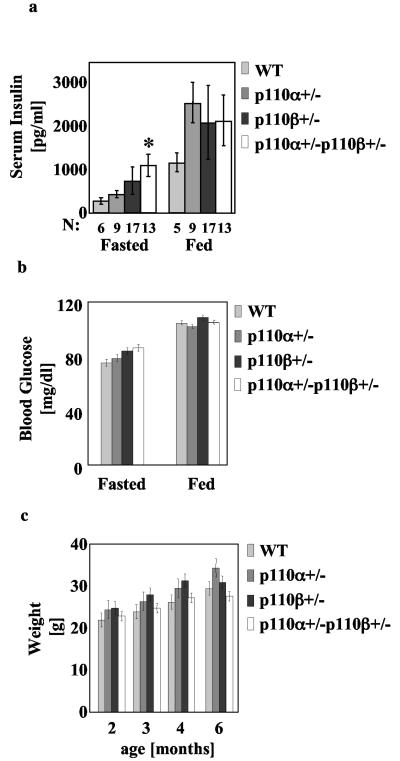
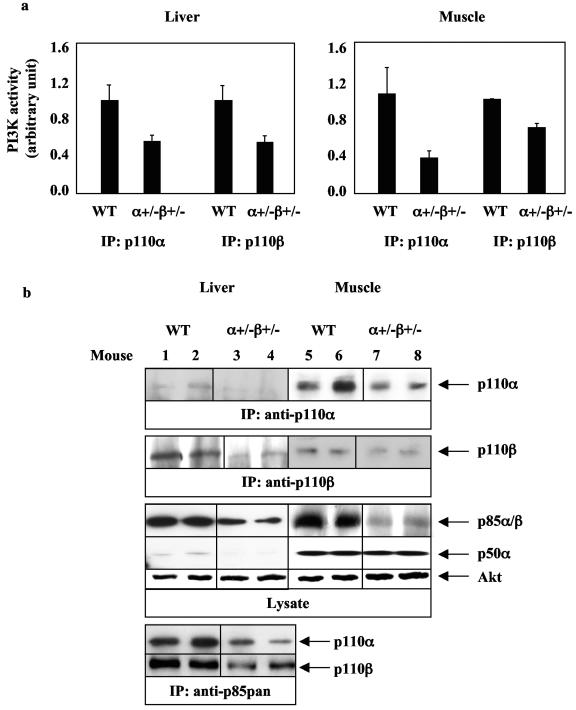
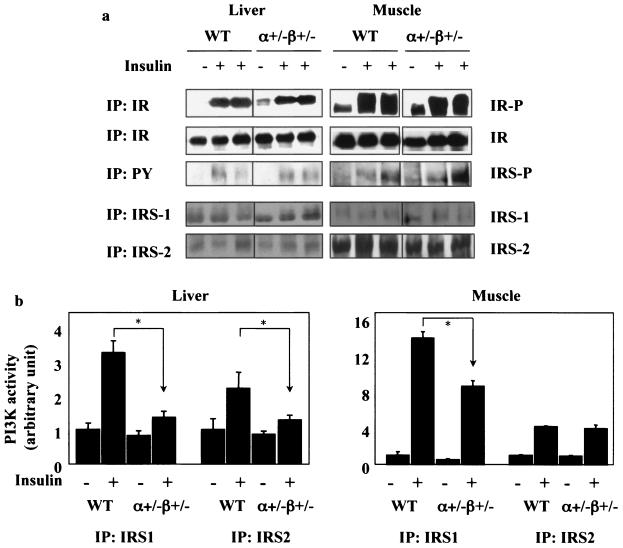
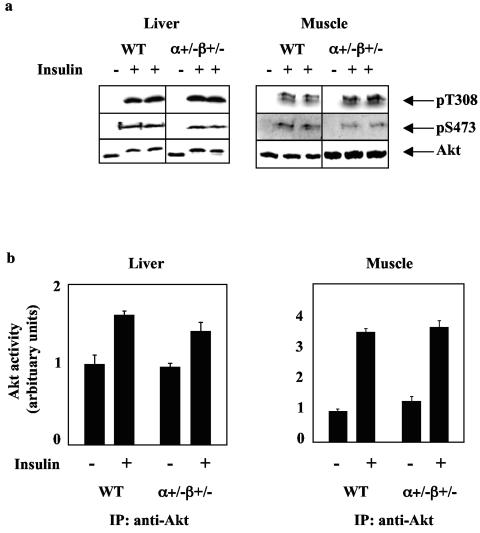
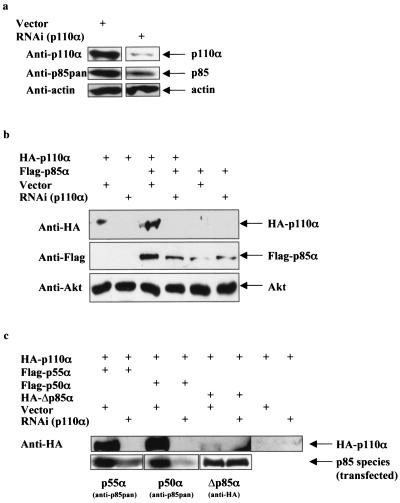
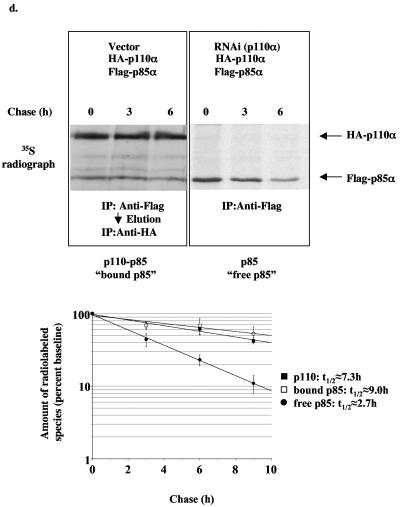
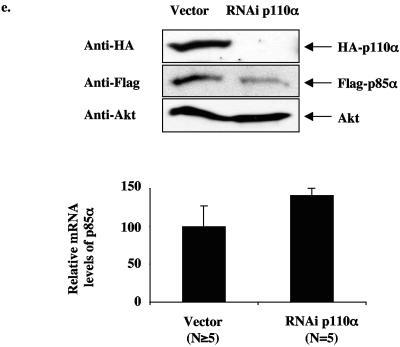
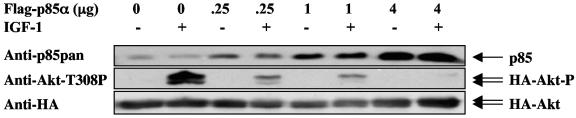
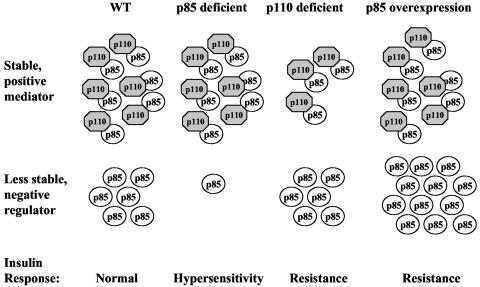
Studies ex vivo have shown that phosphoinositide 3-kinase (PI3K) activity is necessary but not sufficient for insulin-stimulated glucose uptake. Unexpectedly, mice lacking either of the PI3K regulatory subunits p85alpha or p85beta exhibit increased insulin sensitivity. The insulin hypersensitivity is particularly unexpected in p85alpha-/- p55alpha-/- p50alpha-/- mice, where a decrease in p110alpha and p110beta catalytic subunits was observed in insulin-sensitive tissues. These results raised the possibility that decreasing total PI3K available for stimulation by insulin might circumvent negative feedback loops that ultimately shut off insulin-dependent glucose uptake in vivo. Here we present results arguing against this explanation. We show that p110alpha+/- p110beta+/- mice exhibit mild glucose intolerance and hyperinsulinemia in the fasted state. Unexpectedly, p110alpha+/- p110beta+/- mice showed a approximately 50% decrease in p85 expression in liver and muscle. Consistent with this in vivo observation, knockdown of p110 by RNA interference in mammalian cells resulted in loss of p85 proteins due to decreased protein stability. We propose that insulin sensitivity is regulated by a delicate balance between p85 and p110 subunits and that p85 subunits mediate a negative role in insulin signaling independent of their role as mediators of PI3K activation.


Figures

FIG. 1.
FIG. 1.
p110α+/− p110β+/− mice are mildly glucose intolerant. (a) Blood glucose levels (p110α+/− p110β+/−, n = 13; wild type [WT], n = 13; p110α+/−, n = 11; p110β+/−, n = 21) and blood insulin levels (p110α+/− p110β+/−, n = 10; WT, n = 5) were measured in 6-month-old male mice subjected to glucose tolerance tests as described in Materials and Methods. (b) Insulin tolerance test (p110α+/− p110β+/−, n = 10; WT, n = 5; p110α+/−, n = 8; p110β+/−, n = 12) on 6-month-old male mice. Results are means ± standard errors of the means of the blood glucose (GTT) or blood glucose/basal blood glucose ratio (ITT). *, P < 0.05, compared to WT.
FIG. 2.
FIG. 2.
Mild hyperinsulinemia in p110α+/− p110β+/− mice. (a) Plasma insulin concentrations in 6-month-old fasting and fed male mice. Results are means ± standard deviations of the means. *, P < 0.05, compared to wild type (WT). (b) Weights for male mice with the indicated genotypes at different ages. The data express the means ± standard deviations of the means (WT, n = 6; p110α+/−, n = 8; p110β+/−, n = 15; p110α+/− p110β+/−, n = 12). P values were calculated by using the Student t test. There was no statistically significant difference between genotypes. (c) Blood glucose levels of 6-month-old male fasting or fed mice with the indicated genotypes. The data express the means ± standard deviations of the means (WT, n = 6; p110α+/−, n = 8; p110β+/−, n = 15; p110α+/− p110β+/−, n = 12). P values were calculated by using the Student t test. There was no statistically significant difference between genotypes.
FIG. 3.
FIG. 3.
p110α+/− p110β+/− mice have decreased p110 and p85 levels in liver and muscle. (a) PI3K assays in liver (for anti-p110α immunoprecipitation [IP]: wild type [WT], n = 3; p110α+/− p110β+/−, n = 3; for anti-p110β IP: WT, n = 3; p110α+/− p110β+/−, n = 6) and skeletal muscle (for anti-p110β and anti-p110α IP: WT, n = 3; p110α+/− p110β+/−, n = 3) from 4-month-old WT and p110α+/− p110β+/− mice. Results are means ± standard errors of the means and represent one of two experiments. (b) p110α, p110β, and p85 protein levels in liver (left) and skeletal muscle (right) from 4-month-old mice. IP was performed on 2 mg of muscle or 2 mg of liver from WT or p110α+/− p110β+/− mice. A representative experiment is shown. Each lane represents a single mouse.
FIG. 4.
FIG. 4.
p110α+/− p110β+/− mice have decreased IRS- associated PI3K activity in liver and muscle. (a) Phosphorylation of insulin receptor (upper) and insulin receptor substrates (lower) in liver (left) and skeletal muscle (right) from 4-month-old wild-type (WT) and p110α+/− p110β+/− mice injected with saline or 5 U of insulin. Each lane represents a single mouse. (b) PI3K activity associated with IRS1 or IRS2 in liver (WT, n = 2 [−insulin] or n = 3 [+insulin]; p110α+/− p110β+/−, n = 4 [−insulin] or n = 4 [+insulin]) and skeletal muscle (WT, n = 2 [−insulin] or n = 3 [+insulin]; p110α+/− p110β+/−, n = 3 [−insulin] or n = 4 [+insulin]) from 4-month-old WT and p110α+/− p110β+/− mice injected with saline or 5 U of insulin. Results are means ± standard errors of the means and represent one of two experiments. *, P < 0.05 compared to WT. The samples were chosen for similar levels of phosphorylation of the insulin receptor from a total of 18 samples.
FIG. 5.
FIG. 5.
p110α+/− p110β+/− mice have normal insulin-induced Akt activation in liver and muscle. (a) Akt phosphorylation at threonine 308 (pT308) and serine 473 (pS473) and total Akt protein levels in liver and skeletal muscle from 4-month-old wild-type (WT) and p110α+/− p110β+/− mice injected with saline or insulin. (b) Akt activity assays in liver (WT, n = 3 [−insulin] or n = 3 [+insulin]; p110α+/− p110β+/−, n = 3 [−insulin] or n = 6 [+insulin]) and skeletal muscle (WT, n = 2 [−insulin] and n = 3 [+Ins]; p110α+/− p110β+/−, n = 3 [−insulin] or n = 4 [+insulin]) from 4-month-old WT and p110α+/− p110β+/− mice injected with saline or insulin. Results are means ± standard errors of the means and represent one of two experiments. *, P < 0.05 compared to WT. The samples were chosen for similar levels of phosphorylation of the insulin receptor from a total of 18 samples.
FIG. 6.
FIG. 6.
Loss of p110 protein by RNAi causes instability of the p85 protein. (a) Endogenous p110α and p85 protein levels in HeLa cells infected with either empty vector or shRNA to knock down expression of p110α and selected for 7 days with puromycin. (b) p110α and p85α protein levels in CHO cells transiently transfected with bovine HA-p110α or mouse Flag-p85α and either empty vector or shRNA to knock down expression of p110α. (c) p110α, p55α, p50α, and Δp85α protein levels in CHO cells transiently transfected with bovine HA-p110α, mouse Flag-p55α, mouse Flag-p50α, or human HA-Δp85α (p85α lacking the inter-SH2 domain that binds p110) and either empty vector or shRNA to knock down expression of p110α. (d) Pulse-chase experiment of CHO cells transiently transfected with bovine HA-p110α, mouse Flag-p85α, and either empty vector or shRNA for knockdown expression of p110α. Graph shows the amount of radiolabeled p110, p85 bound to p110, and free p85 relative to baseline (t = 0 h). Data express means ± standard errors of the means (p110, n = 5; bound p85, n = 3; free p85, n = 5). (e) Protein and relative mRNA levels of mouse Flag-p85α from CHO cells transiently transfected with bovine HA-p110α, mouse Flag-p85α, and either empty vector or shRNA to knock down expression of p110α. Relative mRNA levels were determined by real-time PCR and normalized to the expression level of 18S rRNA. Results are means of relative mRNA levels ± standard deviations of the means.
FIG. 6.
FIG. 6.
Loss of p110 protein by RNAi causes instability of the p85 protein. (a) Endogenous p110α and p85 protein levels in HeLa cells infected with either empty vector or shRNA to knock down expression of p110α and selected for 7 days with puromycin. (b) p110α and p85α protein levels in CHO cells transiently transfected with bovine HA-p110α or mouse Flag-p85α and either empty vector or shRNA to knock down expression of p110α. (c) p110α, p55α, p50α, and Δp85α protein levels in CHO cells transiently transfected with bovine HA-p110α, mouse Flag-p55α, mouse Flag-p50α, or human HA-Δp85α (p85α lacking the inter-SH2 domain that binds p110) and either empty vector or shRNA to knock down expression of p110α. (d) Pulse-chase experiment of CHO cells transiently transfected with bovine HA-p110α, mouse Flag-p85α, and either empty vector or shRNA for knockdown expression of p110α. Graph shows the amount of radiolabeled p110, p85 bound to p110, and free p85 relative to baseline (t = 0 h). Data express means ± standard errors of the means (p110, n = 5; bound p85, n = 3; free p85, n = 5). (e) Protein and relative mRNA levels of mouse Flag-p85α from CHO cells transiently transfected with bovine HA-p110α, mouse Flag-p85α, and either empty vector or shRNA to knock down expression of p110α. Relative mRNA levels were determined by real-time PCR and normalized to the expression level of 18S rRNA. Results are means of relative mRNA levels ± standard deviations of the means.
FIG. 7.
FIG. 7.
Overexpression of p85 results in decreased insulin sensitivity. HA-Akt and increasing amounts of p85α were cotransfected into CHO cells. The cells were starved overnight,and one set of cells was stimulated with 20 nM IGF-1 for 5 min. The cells were lysed and HA-Akt was immunoprecipitated and blotted with anti-AktT308P antisera.
FIG. 8.
FIG. 8.
Model. Insulin sensitivity is tightly regulated by the ratio of the positive mediator, p110-p85, and the negative regulator, unbound p85. A given ratio between p110-p85 and p85 might define the normal state of insulin sensitivity in a wild-type setting. In p85α+/− or p85β−/− mice, free p85 is decreased preferentially. Therefore, the balance between p110-p85 and free p85 is shifted towards the positive mediator, p110-p85, causing increased insulin sensitivity in the mutant mice. In contrast, in p110α+/− p110β+/− mice the p110-p85 pool is preferentially decreased over free p85. Hence, the balance is shifted towards the negative regulator, free p85, resulting in decreased insulin sensitivity. Overexpression of p85 causes a substantial increase in free p85 and therefore shifts the balance towards the negative regulator, resulting in decreased insulin sensitivity.

References

    1. Aguirre, V., T. Uchida, L. Yenush, R. Davis, and M. F. White. 2000. The c-Jun NH2-terminal kinase promotes insulin resistance during association with insulin receptor substrate-1 and phosphorylation of Ser(307). J. Biol. Chem. 275:9047-9054. - PubMed
    1. Aguirre, V., E. D. Werner, J. Giraud, Y. H. Lee, S. E. Shoelson, and M. F. White. 2002. Phosphorylation of Ser307 in insulin receptor substrate-1 blocks interactions with the insulin receptor and inhibits insulin action. J. Biol. Chem. 277:1531-1537. - PubMed
    1. Asano, T., A. Kanda, H. Katagiri, M. Nawano, T. Ogihara, K. Inukai, M. Anai, Y. Fukushima, Y. Yazaki, M. Kikuchi, R. Hooshmand-Rad, C. H. Heldin, Y. Oka, and M. Funaki. 2000. p110α is up-regulated during differentiation of 3T3-L1 cells and contributes to the highly insulin-responsive glucose transport activity. J. Biol. Chem. 275:17671-17676. - PubMed
    1. Barbour, L. A., J. Shao, L. Qiao, W. Leitner, M. Anderson, J. E. Friedman, and B. Draznin. 2004. Human placental growth hormone increases expression of the p85 regulatory unit of phosphatidylinositol 3-kinase and triggers severe insulin resistance in skeletal muscle. Endocrinology 145:1144-1150. - PubMed
    1. Barroso, I., J. Luan, R. P. Middelberg, A. H. Harding, P. W. Franks, R. W. Jakes, D. Clayton, A. J. Schafer, S. O'Rahilly, and N. J. Wareham. 2003. Candidate gene association study in type 2 diabetes indicates a role for genes involved in beta-cell function as well as insulin action. PLoS Biol. 1:E20. - PMC - PubMed

Publication types

MeSH terms

LinkOut - more resources