. 2005 Mar;25(5):1620-33.
doi: 10.1128/MCB.25.5.1620-1633.2005.

Displacement of SATB1-bound histone deacetylase 1 corepressor by the human immunodeficiency virus type 1 transactivator induces expression of interleukin-2 and its receptor in T cells

Affiliations

Displacement of SATB1-bound histone deacetylase 1 corepressor by the human immunodeficiency virus type 1 transactivator induces expression of interleukin-2 and its receptor in T cells

P Pavan Kumar et al. Mol Cell Biol. 2005 Mar.

Erratum in

Abstract

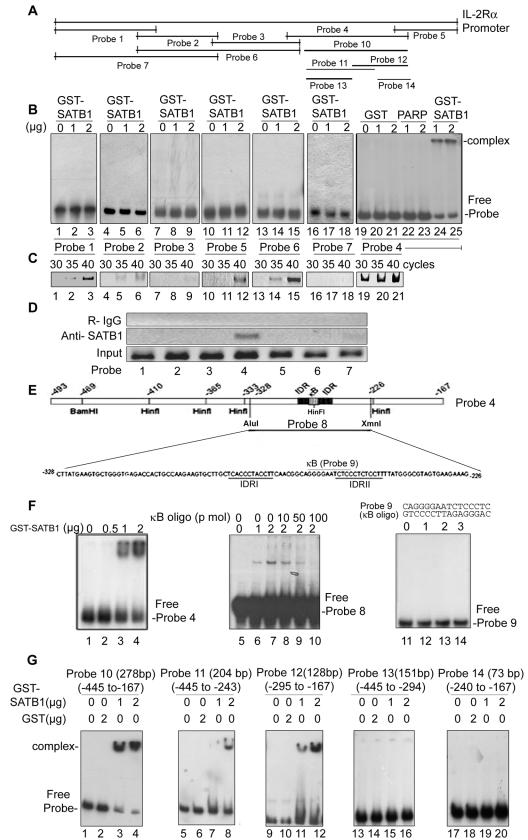
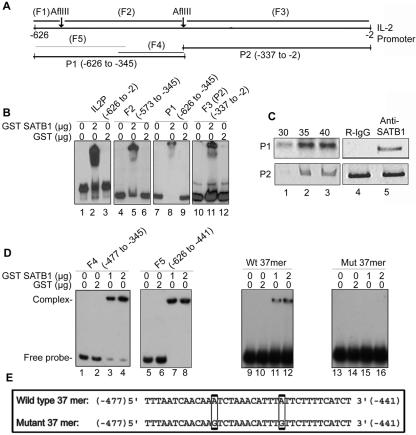
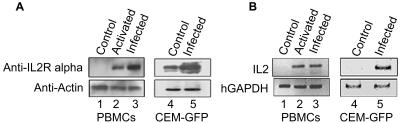
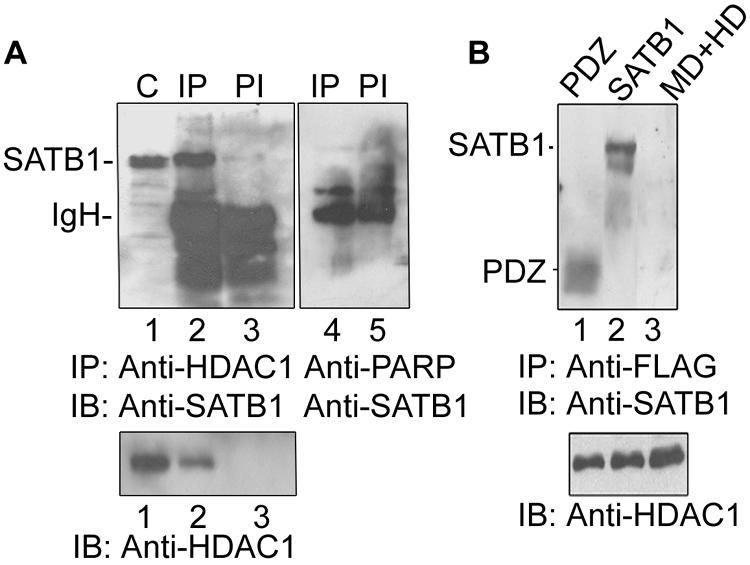
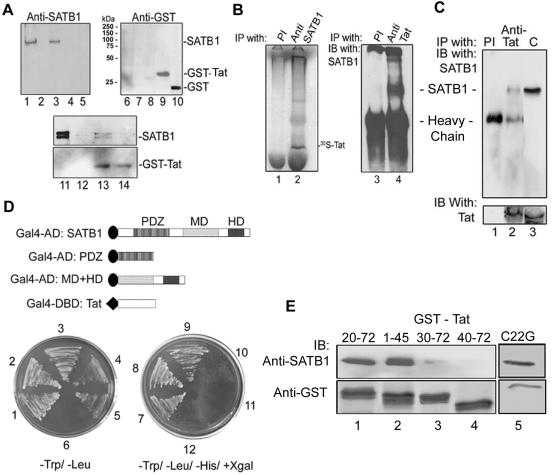
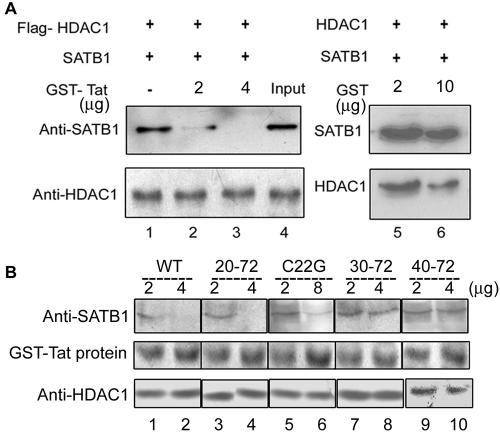
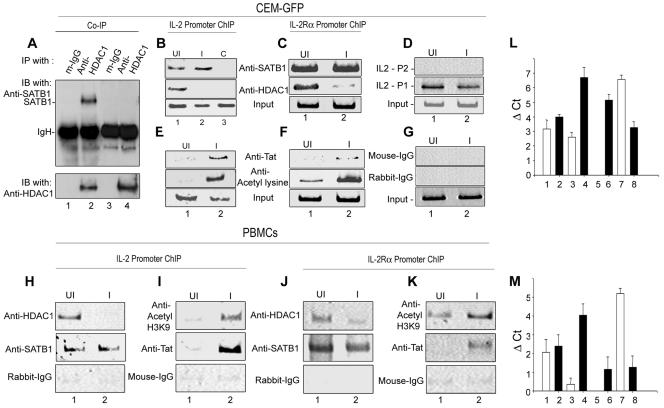
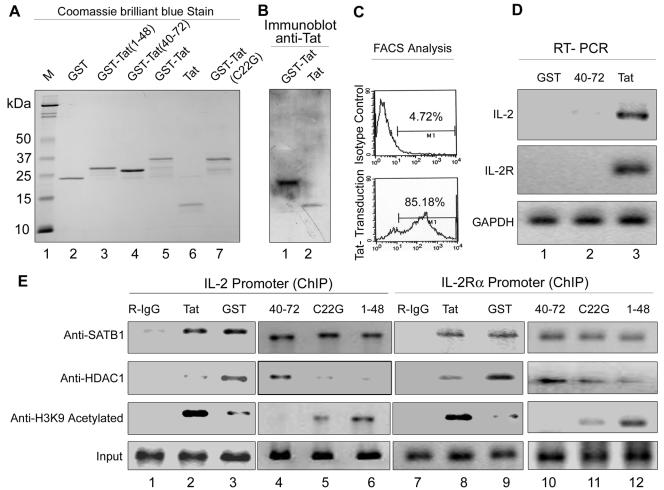
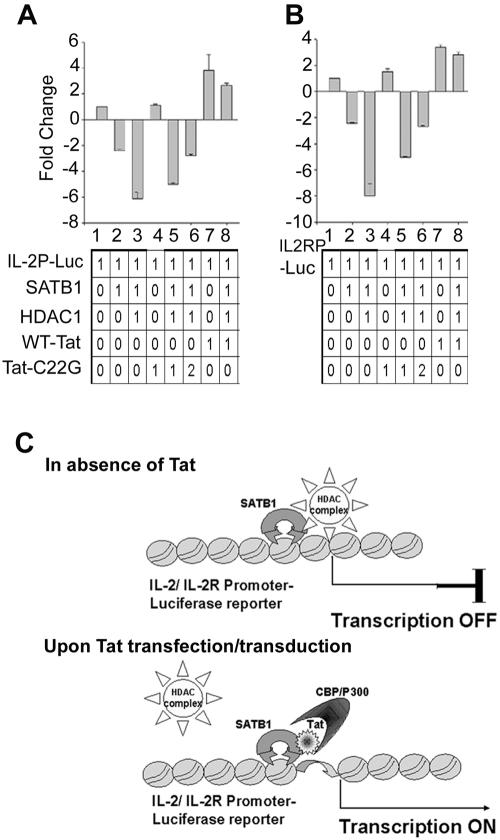
One hallmark of human immunodeficiency virus type 1 (HIV-1) infection is the dysregulation of cytokine gene expression in T cells. Transfection of T cells with human T-cell leukemia type 1 or 2 transactivator results in the induction of the T-cell-restricted cytokine interleukin-2 (IL-2) and its receptor (IL-2Ralpha). However, no T-cell-specific factor(s) has been directly linked with the regulation of IL-2 and IL-2Ralpha transcription by influencing the promoter activity. Thymocytes from SATB1 (special AT-rich sequence binding protein 1) knockout mice have been shown to ectopically express IL-2Ralpha, suggesting involvement of SATB1 in its negative regulation. Here we show that SATB1, a T-cell-specific global gene regulator, binds to the promoters of human IL-2 and IL-2Ralpha and recruits histone deacetylase 1 (HDAC1) in vivo. SATB1 also interacts with Tat in HIV-1-infected T cells. The functional interaction between HIV-1 Tat and SATB1 requires its PDZ-like domain, and the binding of the HDAC1 corepressor occurs through the same. Furthermore, Tat competitively displaces HDAC1 that is bound to SATB1, leading to increased acetylation of the promoters in vivo. Transduction with SATB1 interaction-deficient soluble Tat (Tat 40-72) and reporter assays using a transactivation-negative mutant (C22G) of Tat unequivocally demonstrated that the displacement of HDAC1 itself is sufficient for derepression of these promoters in vivo. These results suggest a novel mechanism by which HIV-1 Tat might overcome SATB1-mediated repression in T cells.


Figures

FIG.1.
FIG.1.
SATB1 binds to the human IL-2Rα promoter in vitro and in vivo. (A) Schematic representation of the IL-2Rα 1.3-kb promoter sequence spanning the base pair −1240 to +110 region. The positions of the probes used for EMSA and ChIP are as indicated. (B) Mapping of the binding site of SATB1 in the IL-2Rα promoter region. EMSA analysis was performed using bacterially expressed and purified GST-SATB1 and 32P-end-labeled probes. Probes 1 (−1240F to −937R), 2 (−957F to −725R), 3 (−746F to −473R), 4 (−493F to −167R), 5 (−187F to +110R), 6 (−957F to −473R), and 7 (−1240F to −725R) were amplified by PCR using specific primer sets. The probes were incubated with 1 μg (lanes 2, 5, 8, 11, 14, 17, and 24), 2 μg of GST-SATB1 (lanes 3, 6, 9, 12, 15, 18, and 25), 1 to 2 μg of GST alone (lanes 20 and 21), and 1 to 2 μg of GST-PARP (lanes 22 and 23). DNA-protein complexes were resolved on native polyacrylamide gels. Usage of probes was as indicated below the lanes. (C) SATB1 binds to the IL2Rα promoter in vivo. DNA purified from CEM-GFP chromatin immunoprecipitated with anti-SATB1 using seven sets of primers encompassing the entire promoter region of IL-2Rα were subjected to 30, 35, and 40 cycles of PCR amplification. Usage of probes was as indicated above the lanes. (D) SATB1 binds specifically to the base pair −493 to −167 region (probe 4) in the IL-2Rα promoter in vivo. The DNA in CEM-GFP cells was chromatin immunoprecipitated with rabbit IgG (R-IgG, top panel) and anti-SATB1 (middle panel) and was subjected to 30 cycles of PCR using a panel of primers as described above. The lower panel depicts the PCR-amplified DNA from total chromatin as a control. (E) Schematic representation of the IL-2Rα base pair −493 to −167 promoter sequence with positions of the probes used for EMSA. The relative positions of useful restriction sites are as indicated. The IDRs are underlined, and the position of the κB-like element is also indicated. (F) An SATB1 binding site encompasses the IDRs in IL-2Rα promoter. EMSA using bacterially expressed and purified SATB1 and the 32P-end-labeled 326-bp probe 4 (lanes 1 to 4) or 103-bp probe 8 generated by AluI and HinfI digestion of the same followed by polyacrylamide gel purification (base pair −328 to −226 fragment). GST-SATB1 was used at 0.5 (lane 2), 1 (lanes 3 and 6), and 2 μg (lanes 4 and 7 to 10) in the binding reactions. Incubation of the reaction mixture with 10-, 50-, and 100-fold concentrations of cold κB duplex oligonucleotide (oligo) as a competitor DNA resulted in loss of binding (lanes 8, 9, and 10, respectively). Similarly, increasing amounts of SATB1 (lane 12, 13, and 14) were incubated with the 32P-end-labeled duplex κB oligonucleotide (probe 9). (G) IDR is essential for binding of SATB1 to the IL-2Rα promoter region. EMSA analysis was performed using bacterially expressed and purified GST-SATB1 and 32P-end-labeled probes. Probe 10 (−445F to −167R), 11 (−445F to −243R), 12 (−295F to −167R), 13 (−445F to −294R), and 14 (−240F to −167R) were PCR amplified using specific primer sets. The probes were incubated with 1 μg of GST-SATB1 (lanes 3, 7, 11, 15, and 19), 2 μg of GST-SATB1 (lanes 4, 8, 12, 16, and 20), and 2 μg of GST alone (lanes 2, 6, 10, 14, and 18). DNA-protein complexes were resolved on native polyacrylamide gels and visualized by autoradiography. Usage of probes was as indicated at the top. Probes 13 and 14 are essentially the same as probes 10 and 11, respectively, except that they lack the IDR.
FIG. 2.
FIG. 2.
SATB1 binds to the human IL-2 promoter in vitro and in vivo. (A) Schematic representation of 0.62-kb IL-2 promoter sequence spanning base pair −626 to −2 region of translation start site. The positions of the probes used for EMSA and ChIP are as indicated. (B) SATB1 binds to the IL-2 promoter in vitro. Mapping of the binding site of SATB1 in the IL-2 promoter region (IL2P) was performed by EMSA analysis as described in Materials and Methods, using 2 μg of bacterially expressed and purified GST-SATB1 and 32P-labeled probes. An equal amount of GST was used as a control in binding reactions. The probes were generated using AflIII restriction digestion (F2 and F3) or PCR amplification using specific primer pairs (full length and P1). (C) In vivo binding of SATB1 to the distal IL-2 promoter. Anti-SATB1 immunoprecipitated chromatin from CEM-GFP cells was amplified with P1 (top) and P2 (bottom) primer sets for 30 (lane 1), 35 (lane 2), and 40 (lane 3) cycles. ChIP analysis was again performed using rabbit IgG (R-IgG, lane 4, upper panel) and anti-SATB1 (lane 5, upper panel) and subjected to 30 cycles of PCR amplification with the P1 primer set. Input (lanes 4 and 5, bottom panel) denotes amplification of the DNA in soluble chromatin prior to immunoprecipitation. (D) SATB1 binds to the 37-mer ATC context present in the distal promoter (P1 region) of the IL-2 promoter. The ATC context containing overlapping regions F4 (−477 to −345) and F5 (−626 to −441) were amplified by PCR using specific primers and labeled using [32P]dCTP. EMSA analysis was performed using 1 (lanes 3 and 7) or 2 (lanes 4 and 8) μg of GST-SATB1 or 2 μg of GST alone (lanes 2 and 5). Wild-type (Wt) and mutant (Mut) forward and reverse 37-mer oligonucleotides were annealed and end labeled with [32P]ATP. Wild-type annealed double-stranded 37-mer oligonucleotide (corresponding to nucleotides −477 to −441 of the IL-2 promoter) displays perfect ATC context whereas the mutant has two A-to-G changes that disrupt the ATC context. Binding reactions were performed as described for F4 and F5. (E) Nucleotide sequences of the wild-type and mutated 37-mer ATC context spanning the region from base pair −477 to base pair -441 from the translation start site of IL-2. The two mutated nucleotides are shown in boxes.
FIG. 3.
FIG. 3.
Induction of IL-2Rα and IL-2 expression upon HIV infection. (A) Immunoblot analysis of total cell lysates from PBMCs (lane 1), activated PBMCs (lane 2), activated and HIV-1-infected PBMCs (lane 3), uninfected CEM-GFP cells (lane 4), and NL4.3-infected CEM-GFP cells (lane 5) using anti-IL-2Rα (upper panel) and anti-actin (lower panel). (B) RT-PCR analysis of PBMCs (lane 1), activated PBMCs (lane 2), activated and HIV-1-infected PBMCs (lane 3), uninfected CEM-GFP cells (lane 4), and NL4.3-infected CEM-GFP cells (lane 5) using primers specific for IL-2 (upper panel) and human GAPDH (hGAPDH, lower panel).
FIG. 4.
FIG. 4.
SATB1 directly interacts with the HDAC1 corepressor via its PDZ domain in vitro and in vivo. (A) In vivo coimmunoprecipitation analysis. SATB1 was immunoprecipitated from Jurkat cell extract using anti-HDAC1 antibody and detected by immunoblot analysis using anti-SATB1 (lane 2). C, control extract alone (lane 1); PI, coimmunoprecipitation using preimmune rabbit serum (lane 3). The lower panel represents an immunoblot (IB) of the same samples with anti-HDAC1, showing that HDAC1 is immunoprecipitated specifically by anti-SATB1 (lane 2) and not by preimmune serum (lane 3). Immunoprecipitation using anti-PARP (lane 4) serves as a negative control. (B) Interacting domain of SATB1 with FLAG-tagged HDAC1 was analyzed by a FLAG pulldown assay followed by immunoblotting using anti-SATB1 as described in Materials and Methods. Anti-FLAG pulled down the PDZ domain (lane 1) and full-length SATB1 (lane 2) but not the MD+HD domain (lane 3). The positions of molecular weight standards are indicated on the right. The lower panel represents an immunoblot with anti-HDAC1 as a loading control.
FIG. 5.
FIG. 5.
HIV-1 Tat physically interacts with SATB1 in vitro and in vivo. (A) SATB1 is eluted by GST-Tat affinity chromatography. Nuclear extracts from Jurkat and 293 cells were passed separately on GST-Tat and GST affinity columns. Bound proteins were eluted with phosphate buffer containing 1 M NaCl (lanes 3 and 13) or with reduced glutathione (lanes 9 and 14). Proteins from GST-bound Sepharose were eluted with reduced glutathione only (lanes 5 and 10). Column input (lanes 1, 6, and 11), flowthrough (lanes 2, 7, and 12), and wash using phosphate-buffered saline (lanes 4 and 8). (B) In vitro-translated 35S-labeled Tat and cold SATB1 were mixed and immunoprecipitated with normal rabbit serum (lane 1 and 3), anti-SATB1 (lane 2), and anti-Tat (lane 4). The immunoprecipitated proteins were detected by autoradiography (left panel) or immunoblot analysis using anti-SATB1 (right panel). NRS, normal rabbit serum; IP, immunoprecipitation, IB, immunoblot. (C) SATB1 immunoprecipitated using anti-Tat antibody in extract from NL4.3-infected CEM-GFP cells (lane 2) was detected by immunoblot analysis using anti-SATB1. Lane 3 (C, control) shows proteins in cell extract used for coimmunoprecipitation. The lower panel represents an immunoblot with anti-Tat. (D) Yeast two-hybrid analysis. Various constructs used for yeast two-hybrid analyses are schematically represented above the two plates depicting growth of cotransformants. Panels 1 and 2 and 7 and 8 represent the cotransformation of Gal4-AD:SATB1 and Gal4-AD:PDZ with Gal4-DBD:Tat, respectively. Panels 3 and 9 represent p53 and T antigen as positive controls, 4 and 10 represent p53 and lamin C as negative controls, 5 and 11 represent the Gal4-AD:MD+HD and Gal4-DBD:Tat cotransformation, and 6 and 12 represent the mock-transformed cells as controls. (E) Delineation of the interaction domain of Tat with SATB1. Nuclear extracts from Jurkat cells were passed separately on GST-fused Tat 20-72, 1-45, 30-72, and 40-72 truncations and GST-Tat C22G mutant affinity columns. Bound proteins were eluted from the GST-Tat affinity column with phosphate buffer containing 1 M NaCl (lanes 1 to 5, top panel) or with reduced glutathione (lanes 1 to 5, lower panel). Salt-eluted proteins were subjected to Western blotting using anti-SATB1 (upper panel), whereas proteins eluted with reduced glutathione were subjected to immunoblot analysis using anti-GST (lower panel).
FIG. 6.
FIG. 6.
Tat displaces SATB1-bound HDAC1 in vitro. (A) A competition assay was performed to analyze the binding of HDAC1 and Tat to SATB1 in vitro. The SATB1-HDAC1 complex was isolated using anti-FLAG affinity beads in the FLAG pulldown assay as described in Materials and Methods (lane 1). The complex was incubated with 2 and 4 μg of recombinant GST-Tat and pulled down using FLAG beads (lanes 2 and 3, respectively). Lane 4 represents the input lysate. As a control, the complex was incubated with 2 and 10 μg of purified GST and pulled down with FLAG beads (lanes 5 and 6). The lower panel represents an immunoblot analysis of these samples using anti-HDAC1. (B) A competition assay was performed to analyze the HDAC1-displacing ability of mutant and truncated Tat from the HDAC1-SATB1 complex in vitro. 293 cells were transiently transfected with FLAG-HDAC1, and the SATB1-HDAC1 complex was isolated using anti-FLAG affinity beads in the FLAG pulldown assay. The complex was incubated with 2 and 4 μg of recombinant wild-type GST-Tat (lanes 1 and 2), GST-Tat 20-72 (lanes 3 and 4), GST-Tat 30-72 (lanes 7 and 8), and GST-Tat 40-72 (lanes 9 and 10, respectively) and pulled down using FLAG beads. In the case of pulldown using the GST-Tat C22G mutant, 2 and 8 μg of protein were used (lanes 5 and 6, respectively). The middle panel represents the purified GST-Tat proteins stained with Coomassie brilliant blue. The lower panel represents an immunoblot analysis of these samples using anti-HDAC1 and serves as loading control.
FIG. 7.
FIG. 7.
Tat displaces SATB1-bound HDAC1 in HIV-1 infected T cells, leading to increased acetylation of promoters. (A) Coimmunoprecipitation (Co-IP) analysis using extracts from uninfected (lanes 1 and 2) and NL4.3-infected (lanes 3 and 4) CEM-GFP cells. Immunoprecipitation was carried out using mouse IgG1 (lanes 1 and 3) and anti-HDAC1 antibody (lanes 2 and 4). As a control, a mixture of normal rabbit IgG and mouse monoclonal IgG1 was used (lane 3). IB, immunoblotting. (B and E) ChIP analysis of IL-2 promoter. PCR amplification of DNA isolated from immunoprecipitated chromatin was performed as described above by using the IL-2-P1 primer pair. The antibodies used for immunoprecipitation are as indicated. UI, uninfected; I, infected; C, control. (C and F) ChIP analysis of the IL-2Rα promoter. DNA isolated from immunoprecipitated chromatin from the uninfected and infected CEM cells using anti-SATB1, anti-HDAC1, anti-Tat, and anti-acetylated H3-K9 antibodies were PCR amplified. Input represents PCR amplification of the DNA in total cross-linked chromatin. (D) ChIP analysis of the IL-2 promoter was performed using anti-SATB1 immunoprecipitated chromatin and IL-2-P1 (middle panel) and IL-2-P2 (upper panel) primer pairs. (G) As a control, normal rabbit IgG (middle panel) and mouse monoclonal IgG1 (upper panel) were used for immunoprecipitation of cross-linked chromatin, and DNA in the immunoprecipitate was amplified using the IL-2-P1 primer pair. ChIP analysis of chromatin from uninfected and HIV-1-infected PBMCs was also performed using primers specific for IL-2 (H and I) and IL-2Rα (J and K) promoters. The antibodies used for immunoprecipitation were as indicated. Quantification of immunoprecipitated chromatin was performed by real-time PCR analysis. The changes in amount of immunoprecipitated chromatin (Δ Ct) were calculated as described in Materials and Methods. Values from three independent ChIP experiments were plotted for the IL-2 (L) and IL-2R (M) promoters. The antibodies used for ChIP are anti-SATB1 (1 and 2), anti-HDAC1 (3 and 4), anti-Tat (5 and 6), and anti-histone H3 acetyl lysine 9 (7 and 8). Solid and empty bars indicate infected and uninfected samples, respectively.
FIG. 8.
FIG. 8.
Transduction of soluble Tat upregulates IL-2 and IL-2R and increases the acetylation status of IL-2 and IL-2Rα promoters in Jurkat T cells. (A) SDS-15% PAGE analysis of purified recombinant Tat proteins. Wild-type Tat (lane 5), Tat 1-48 (lane 3), Tat 40-72 (lane 4), and C22G mutant Tat (lane 7) were expressed as GST fusions in BL21 cells and purified as described in Materials and Methods. Tat (lane 6) and GST (lane 2) were obtained by thrombin cleavage. B. Recombinant GST-Tat (lane 1) and Tat (lane 2) proteins were transduced separately into Jurkat cells, and nuclear lysates were prepared as described in Materials and Methods. The nuclear lysates were resolved by electrophoresis in 15% SDS-polyacrylamide gels followed by Western blot analysis using anti-Tat antibody. (C) Flow cytometric (FACS) analysis of transduced cells. Cells incubated with 100 ng of recombinant Tat for 4 h were immunostained using rabbit IgG (upper histogram) or anti-Tat (lower histogram) and acquired on a flow cytometer as described in Materials and Methods. (D) RT-PCR analysis of mRNA from transduced cells. Total mRNA was isolated from Jurkat cells incubated with GST (lane 1), GST-Tat 40-72 (lane 2), and GAT-Tat (lane 3). RT-PCR analysis was performed using IL-2 (upper panel), IL-2R (middle panel), and GAPDH (lower panel) cDNA primers. (E) HDAC1 occupancy and promoter acetylation are inversely correlated. To monitor the acetylation status of IL-2 and IL-2R promoters independent of HIV-1 virion exposure, we transduced the wild-type Tat (lanes 2 and 8), GST (lanes 3 and 9), Tat-40-72 (lanes 4 and 10), Tat-C22G (lanes 5 and 11), and Tat-1-48 (lanes 6 and 12) proteins into Jurkat cells as described in Materials and Methods. Chromatin was then prepared and subjected to ChIP analysis using anti-SATB1, anti-HDAC1, and anti-H3 acetylated lysine 9 antibodies. As negative and positive controls we used rabbit IgG (R-IgG, lanes 1 and 7) and input chromatin (bottom panels), respectively.
FIG. 9.
FIG. 9.
Tat-mediated derepression of IL-2 and IL-2Rα transcription in 293 cells exogenously expressing SATB1, HDAC1, and Tat. The effect of Tat mutants in the derepression of IL-2 (A) and IL-2Rα (B) is shown. A luciferase (Luc) reporter assay was performed upon cotransfections of 1 to 2 μg of various expression constructs along with IL-2-luciferase (A) or IL-2Rα-luciferase (B) reporter constructs. Cells were harvested 40 h after transfection, and luciferase activity was measured using 50 μg of protein from each cell lysate. Luciferase activity is expressed as increase or decrease compared to the control (lane 1), which was set to baseline. Lane 1, reporter construct alone; lane 2, SATB1; lane 3, SATB1 + HDAC1; lane 4, Tat C22G; lane 5, SATB1 + HDAC1 + C22G (1 μg); lane 6, SATB1 + HDAC1 + C22G (2 μg); lane 7, wild-type Tat (WT-Tat); lane 8, SATB1 + HDAC1 + Tat. Data from triplicates are plotted, and relative luciferase units are represented as increase or decrease in activity with respect to the reporter alone. The statistical significance of differences between the treatment groups was calculated using one-way analysis of variance, and the observed P values were always less than 0.001. (C) Model depicting HDAC1 displacement following Tat transfection. In the absence of Tat, SATB1 represses transcription of the reporter by recruiting the HDAC1 corepressor. When Tat is introduced, it binds to the PDZ-like domain of SATB1 and displaces HDAC1, thereby stimulating transcription. For details, see the text.

Similar articles

Cited by

References

    1. Adachi, A., H. E. Gendelman, S. Koenig, T. Folks, R. Willey, A. Rabson, and M. A. Martin. 1986. Production of acquired immunodeficiency syndrome-associated retrovirus in human and nonhuman cells transfected with an infectious molecular clone. J. Virol. 59:284-291. - PMC - PubMed
    1. Alvarez, J. D., D. H. Yasui, H. Niida, T. Joh, D. Y. Loh, and T. Kohwi-Shigematsu. 2000. The MAR-binding protein SATB1 orchestrates temporal and spatial expression of multiple genes during T-cell development. Genes Dev. 14:521-535. - PMC - PubMed
    1. Bahr, G. M., E. C. Darcissac, and Y. Mouton. 2003. Discordant effects of interleukin-2 on viral and immune parameters in human immunodeficiency virus-1-infected monocyte-derived mature dendritic cells. Clin. Exp. Immunol. 132:289-296. - PMC - PubMed
    1. Berger, S. L. 2002. Histone modifications in transcriptional regulation. Curr. Opin. Genet. Dev. 12:142-148. - PubMed
    1. Buonaguro, L., G. Barillari, H. K. Chang, C. A. Bohan, V. Kao, R. Morgan, R. C. Gallo, and B. Ensoli. 1992. Effects of the human immunodeficiency virus type 1 Tat protein on the expression of inflammatory cytokines. J. Virol. 66:7159-7167. - PMC - PubMed

Publication types

MeSH terms