

Ikaros induces quiescence and T-cell differentiation in a leukemia cell line
- PMID: 15713624
- PMCID: PMC549358
- DOI: 10.1128/MCB.25.5.1645-1654.2005
Ikaros induces quiescence and T-cell differentiation in a leukemia cell line
Abstract
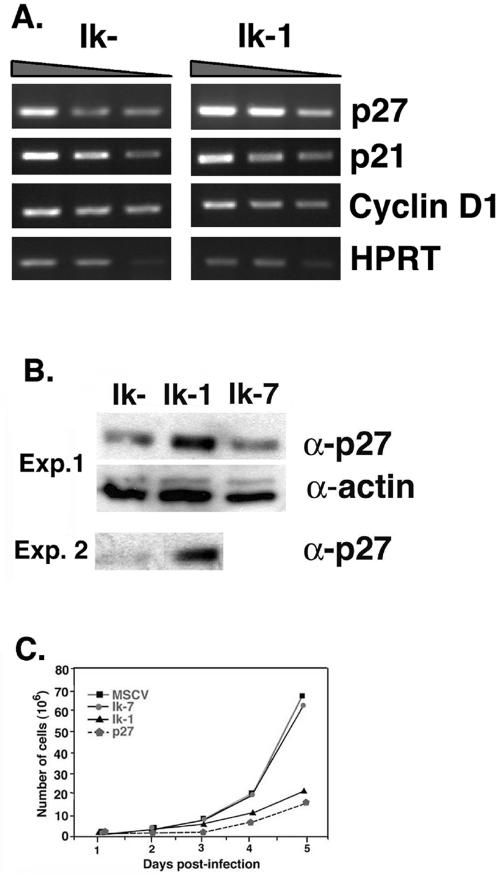
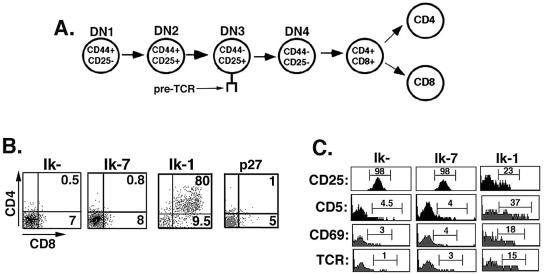
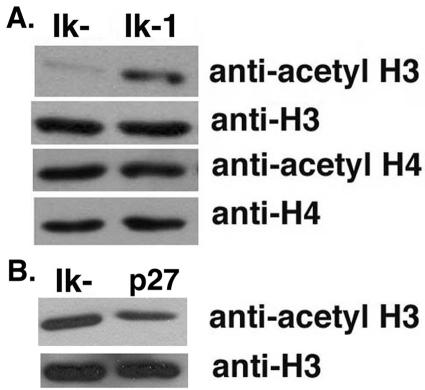
Ikaros is a hematopoietic cell-specific zinc finger DNA binding protein that plays an important role in lymphocyte development. Genetic disruption of Ikaros results in T-cell transformation. Ikaros null mice develop leukemia with 100% penetrance. It has been hypothesized that Ikaros controls gene expression through its association with chromatin remodeling complexes. The development of leukemia in Ikaros null mice suggests that Ikaros has the characteristics of a tumor suppressor gene. In this report, we show that the introduction of Ikaros into an established mouse Ikaros null T leukemia cell line leads to growth arrest at the G0/G1 stage of the cell cycle. This arrest is associated with up-regulation of the cell cycle-dependent kinase inhibitor p27kip1, the induction of expression of T-cell differentiation markers, and a global and specific increase in histone H3 acetylation status. These studies provide strong evidence that Ikaros possesses the properties of a bona fide tumor suppressor gene for the T-cell lineage and offer insight into the mechanism of Ikaros's tumor suppressive activity.
Figures
Similar articles
-
The role of the Ikaros gene in lymphocyte development and homeostasis.Annu Rev Immunol. 1997;15:155-76. doi: 10.1146/annurev.immunol.15.1.155. Annu Rev Immunol. 1997. PMID: 9143685 Review.
-
Loss of Smad3 in acute T-cell lymphoblastic leukemia.N Engl J Med. 2004 Aug 5;351(6):552-9. doi: 10.1056/NEJMoa031197. N Engl J Med. 2004. PMID: 15295048
-
Ikaros represses the transcriptional response to Notch signaling in T-cell development.Mol Cell Biol. 2008 Dec;28(24):7465-75. doi: 10.1128/MCB.00715-08. Epub 2008 Oct 13. Mol Cell Biol. 2008. PMID: 18852286 Free PMC article.
-
Regulation of L-selectin expression by a dominant negative Ikaros protein.J Leukoc Biol. 2001 Apr;69(4):675-83. J Leukoc Biol. 2001. PMID: 11310856
-
Pathogenesis and regulation of cellular proliferation in acute lymphoblastic leukemia - the role of Ikaros.J BUON. 2014 Jan-Mar;19(1):22-8. J BUON. 2014. PMID: 24659638 Review.
Cited by
-
Interferon regulatory factors 4 and 8 induce the expression of Ikaros and Aiolos to down-regulate pre-B-cell receptor and promote cell-cycle withdrawal in pre-B-cell development.Blood. 2008 Feb 1;111(3):1396-403. doi: 10.1182/blood-2007-08-110106. Epub 2007 Oct 30. Blood. 2008. PMID: 17971486 Free PMC article.
-
Ikaros tumor suppressor function includes induction of active enhancers and super-enhancers along with pioneering activity.Leukemia. 2019 Nov;33(11):2720-2731. doi: 10.1038/s41375-019-0474-0. Epub 2019 May 9. Leukemia. 2019. PMID: 31073152 Free PMC article.
-
Transcriptional Regulation of JARID1B/KDM5B Histone Demethylase by Ikaros, Histone Deacetylase 1 (HDAC1), and Casein Kinase 2 (CK2) in B-cell Acute Lymphoblastic Leukemia.J Biol Chem. 2016 Feb 19;291(8):4004-18. doi: 10.1074/jbc.M115.679332. Epub 2015 Dec 10. J Biol Chem. 2016. PMID: 26655717 Free PMC article.
-
Lack of Ikaros cripples expression of Foxo1 and its targets in naive T cells.Immunology. 2017 Nov;152(3):494-506. doi: 10.1111/imm.12786. Epub 2017 Aug 23. Immunology. 2017. PMID: 28670688 Free PMC article.
-
Activated Notch counteracts Ikaros tumor suppression in mouse and human T-cell acute lymphoblastic leukemia.Leukemia. 2015 Jun;29(6):1301-11. doi: 10.1038/leu.2015.27. Epub 2015 Feb 6. Leukemia. 2015. PMID: 25655195 Free PMC article.
References
-
- Almog, N., and V. Rotter. 1997. Involvement of p53 in cell differentiation and development. Biochim. Biophys. Acta 1333:F1-F27. - PubMed
-
- Avitahl, N., S. Winandy, C. Friedrich, B. Jones, Y. Ge, and K. Georgopoulos. 1999. Ikaros sets thresholds for T cell activation and regulates chromosome propagation. Immunity 10:333-343. - PubMed
-
- Banerjee, D., H. J. Lenz, B. Schnieders, D. J. Manno, J. F. Ju, C. P. Spears, D. Hochhauser, K. Danenberg, P. Danenberg, and J. R. Bertino. 1995. Transfection of wild-type but not mutant p53 induces early monocytic differentiation in HL60 cells and increases their sensitivity to stress. Cell Growth Differ. 6:1405-1413. - PubMed
-
- Brown, K. E., S. S. Guest, S. T. Smale, K. Hahm, M. Merkenschlager, and A. G. Fisher. 1997. Association of transcriptionally silent genes with Ikaros complexes at centromeric heterochromatin. Cell 91:845-854. - PubMed
-
- Chen, P. L., Y. M. Chen, R. Bookstein, and W. H. Lee. 1990. Genetic mechanisms of tumor suppression by the human p53 gene. Science 250:1576-1580. - PubMed
Publication types
MeSH terms
Substances
LinkOut - more resources
Full Text Sources
Research Materials