. 2005 Mar;25(5):1804-20.
doi: 10.1128/MCB.25.5.1804-1820.2005.

Formation of an active tissue-specific chromatin domain initiated by epigenetic marking at the embryonic stem cell stage

Affiliations

Formation of an active tissue-specific chromatin domain initiated by epigenetic marking at the embryonic stem cell stage

Henrietta Szutorisz et al. Mol Cell Biol. 2005 Mar.

Abstract

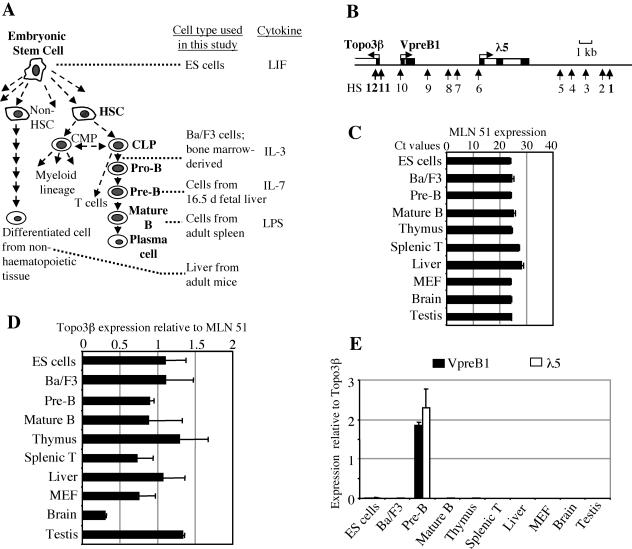
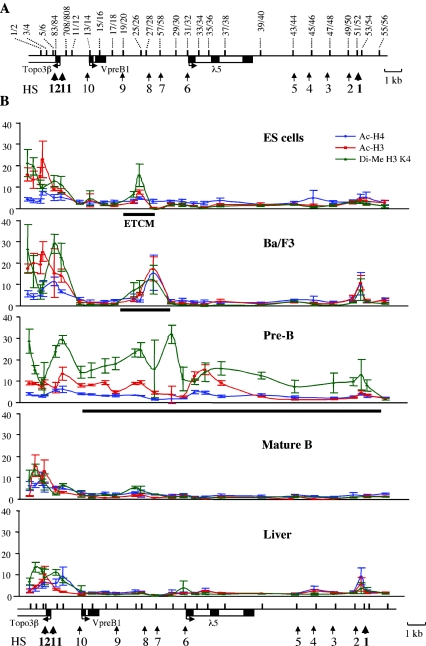
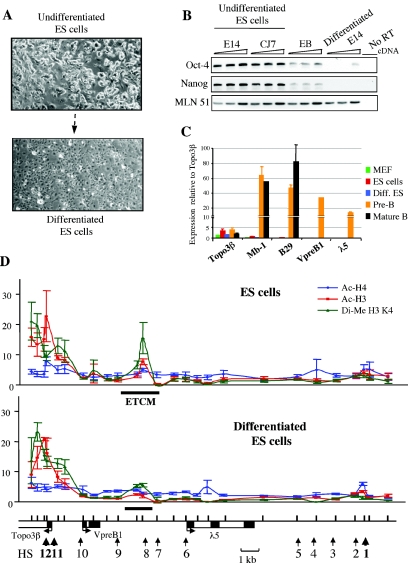
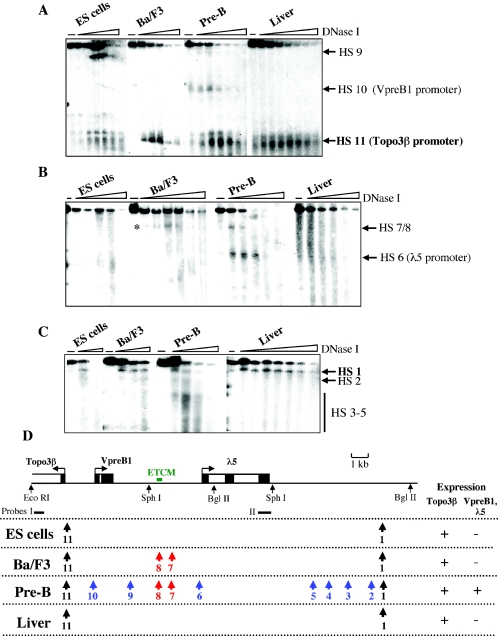
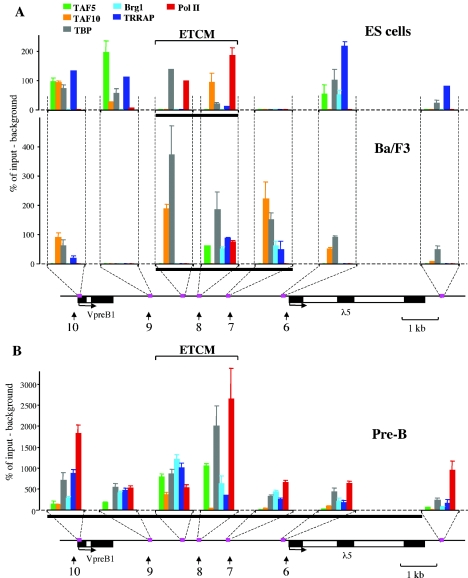
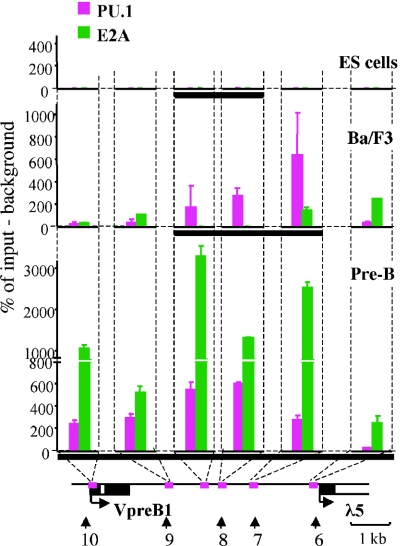
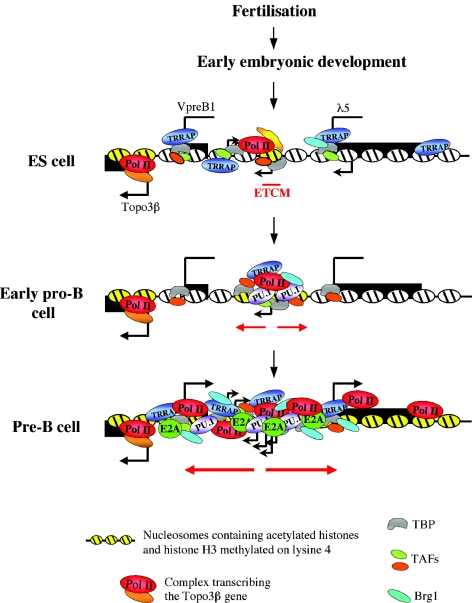
The differentiation potential of stem cells is determined by the ability of these cells to establish and maintain developmentally regulated gene expression programs that are specific to different lineages. Although transcriptionally potentiated epigenetic states of genes have been described for haematopoietic progenitors, the developmental stage at which the formation of lineage-specific gene expression domains is initiated remains unclear. In this study, we show that an intergenic cis-acting element in the mouse lambda5-VpreB1 locus is marked by histone H3 acetylation and histone H3 lysine 4 methylation at a discrete site in embryonic stem (ES) cells. The epigenetic modifications spread from this site toward the VpreB1 and lambda5 genes at later stages of B-cell development, and a large, active chromatin domain is established in pre-B cells when the genes are fully expressed. In early B-cell progenitors, the binding of haematopoietic factor PU.1 coincides with the expansion of the marked region, and the region becomes a center for the recruitment of general transcription factors and RNA polymerase II. In pre-B cells, E2A also binds to the locus, and general transcription factors are distributed across the active domain, including the gene promoters and the intergenic region. These results suggest that localized epigenetic marking is important for establishing the transcriptional competence of the lambda5 and VpreB1 genes as early as the pluripotent ES cell stage.


Figures

FIG. 1.
FIG. 1.
Experimental system and gene expression analysis. (A) Scheme showing haematopoietic cell differentiation and cell types that were used to represent differentiation stages. ES cells give rise to more specialized, multipotent stem cells, such as haematopoietic stem cells (HSC). HSC develop into common myeloid progenitors (CMP), which generate the myeloid lineage. Common lymphoid progenitors (CLP) give rise to the lymphoid lineage. The relationship between CMP and CLP is controversial (reviewed in reference 32). The B-cell lineage differentiates through progenitor B cells (pro-B cells) and precursor B cells (pre-B cells) and finally generates antibody-producing plasma cells. Ba/F3 cells are IL-3-dependent early pro-B cells. d, day; LPS, lipopolysaccharide. (B) Organization of the λ5-VpreB1 locus. VpreB1 and λ5 are transcribed on the same DNA strand (sense direction), whereas Topo3β is transcribed on the opposite strand (antisense direction). Black and white boxes symbolize exons and introns, respectively. Vertical arrows show the positions of the 12 previously mapped DNase I HS (49a, 66). Constitutive HS1, HS11, and HS12 are shown in bold type; the other HS (HS2 to HS10) are pre-B-cell specific. (C) Pattern of expression of the MLN51 gene. Ct values represent the cycle numbers in real-time PCR at which signals start to be detectable above the threshold. Accordingly, the higher the Ct value, the lower the expression level. MEF, mouse embryonic fibroblasts. (D) Expression of the Topo3β gene. Real-time RT-PCR signals for Topo3β were normalized to those for MLN51. (E) Expression of VpreB and λ5. Signals were normalized to those for Topo3β. Error bars in panels D and E indicate standard deviations.
FIG. 2.
FIG. 2.
Patterns of histone modifications in stem cells and differentiated cells. (A) Positions of primers that were used in this study. Thick vertical lines in the locus map indicate PCR amplicon positions; numbers above the locus map correspond to primer pairs. Primer sequences and PCR conditions are shown in Table 1. (B) Histone modification state of the λ5-VpreB1 locus at different stages of B-cell development. ChIP analysis was performed with unfixed chromatin and antibodies against acetylated (Ac) histones H4 and H3 and dimethylated (Di-Me) histone H3 K4 as described in Materials and Methods. A similar analysis with nonspecific IgG antibody or no antibody confirmed that histone modification signals were detected above the background (data not shown). Fold enrichment of target sequences in the immunoprecipitated material relative to the input material is shown on the y axis of each plot. x axes represent positions across the λ5-VpreB1 domain. Error bars indicate standard deviations. A locus map is shown below the plots; amplicon positions are indicated by black vertical lines. A thick black horizontal line below a plot indicates the region in the λ5-VpreB1 domain that is marked by acetylation and K4 dimethylation of histone H3. The tightly localized mark in ES cells was termed the ETCM.
FIG. 3.
FIG. 3.
Loss of ETCM during in vitro differentiation of ES cells. (A) Morphology of ES cells after in vitro differentiation. (B) Expression of ES cell factors during in vitro differentiation of ES cells. The cells were tested for Oct-4 and Nanog expression by RT-PCR. The measurements for each stage were obtained from three sequential fivefold dilutions. Two independent ES cell lines, E14 and CJ7, expressed these ES cell factors, and their expression was downregulated in embryoid bodies (EB) and lost in differentiated E14 ES cells. MLN51 served as a loading control. (C) In vitro differentiated (Diff.) ES cells do not express B-cell-specific genes. Real-time RT-PCR signals were normalized to those for MLN51. MEF, mouse embryonic fibroblasts. Error bars indicate standard deviations. (D) ChIP analysis of the λ5-VpreB1 domain in in vitro differentiated ES cells. Explanations of the plots are given in the legend to Fig. 2B. Note the reduction in histone modifications at the ETCM in differentiated ES cells. The low residual signal could be attributed to a small number of undifferentiated ES cells that remained in the differentiated culture.
FIG.4.
FIG.4.
Changes in patterns of DNase I HS during differentiation. The 12 HS in pre-B cells were mapped elsewhere ( 49a). (A) Pattern of HS at the 5′ region of the λ5-VpreB1 domain. DNA was digested with EcoRI and SphI, Southern blotted, and hybridized with probe I (see the map in panel D). (B) Pattern of HS in the central part of the λ5-VpreB1 domain. DNA was digested with SphI, Southern blotted, andhybridized with probe II (see the map in panel D). The appearance of HS7 and HS8 in Ba/F3 early pro-B cells is indicated by an asterisk. (C) Mapping of HS downstream of the λ5 gene. DNA was digested with BglII, Southern blotted, and hybridized with probe II. (D) Summary of HS patterns at successive differentiation stages. Restriction sites and locations of probes used for mapping are shown below the locus map. Color key: black, constitutive HS; blue, pre-B-cell-specific HS; red, HS found in early pro-B and pre-B cells.
FIG. 5.
FIG. 5.
The ETCM is a center for general transcription factor recruitment during B-cell development. (A) Binding profiles for general transcription factors at early stages of B-cell differentiation. ChIP analysis was performed with fixed chromatin as described in Materials and Methods. The percentage of target sequences in the immunoprecipitated material relative to the input material is shown on the y axis of each plot. Background immunoprecipitation (an average normalized value obtained by treatment of chromatin with two nonspecific antibodies and with no antibody) was subtracted from normalized specific ChIP signals (obtained by immunoprecipitation with antibodies to general transcription factors) at each position. x axes represent positions across the λ5-VpreB1 domain. A locus map is shown below the plots; amplicon positions are indicated by pink boxes. A thick black horizontal line below each plot indicates the region in the λ5-VpreB1 domain that is marked by acetylation and K4 dimethylation of histone H3. (B) Binding profiles for general transcription factors at the pre-B-cell stage. Quantification, symbols, and color codes are explained in panel A. Because of the higher level of transcription factor binding in pre-B cells, the scale on the y axis is different from that in panel A. Error bars in panels A and B indicate standard deviations.
FIG. 6.
FIG. 6.
ChIP analysis of binding of lineage-specific transcription factors E2A and PU.1. ChIP was performed with fixed chromatin as described in Material and Methods. Explanations are given in the legend to Fig. 5. A thick black horizontal line below each plot indicates the region in the λ5-VpreB1 domain that is marked by acetylation and K4 dimethylation of histone H3.
FIG. 7.
FIG. 7.
Mapping of transcription initiation sites by RACE. (A) Mapping of λ5 transcription start sites (upper panel) and intergenic initiation sites (lower panel). RT and PCR approaches are shown for each mapping strategy. 3′ primers (RT, PCR1, and PCR2) that were used for each region are indicated as short thick horizontal lines extended by dotted lines that represent the part of the transcript that was converted into cDNA. RT was performed with locus-specific 3′ primers to detect RNAs transcribed from either the leading or the lagging DNA strand. The orientation of transcription corresponding to each strategy is indicated by arrowheads. Nested PCR products (PCR2; red lines) were cloned and sequenced. (B) Pattern of intergenic transcription initiation sites. Numbers in italics below the locus map indicate positions of transcription initiation sites for the three genes relative to the EcoRI site 2.8 kb upstream from VpreB1. Arrowheads indicate the transcription initiation sites that were mapped in various cell types. The direction of the transcripts is also represented by these arrowheads. (C) Positions of transcription initiation sites. Numbers correspond to positions in the 19-kb locus sequence (as in panel B). Correct initiation sites for the λ5 gene are shown in bold type. Numbers in parentheses after position numbers indicate how many sequenced clones contained that particular initiation site when there was more than one. S, sense; AS, antisense (relative to the directions of VpreB1 and λ5 transcription).
FIG. 8.
FIG. 8.
Schematic illustration of the formation of the active λ5-VpreB1 domain. The Topo3β gene is expressed throughout the entire differentiation program. VpreB1 and λ5 are in a transcriptionally potentiated but inactive state in ES cells and in early pro-B cells. Black arrows represent intergenic transcription initiation sites. The ETCM is a localized histone modification mark in ES cells that is likely to be established by sequence-specific transcription factors (yellow shapes). In addition to factor recruitment to the ETCM region, the λ5-VpreB1 domain is permissive for the binding of general transcription factors at the ES cell stage. Note that Pol II binds only to the ETCM. Expansion of the mark in early pro-B cells (red arrows) would facilitate the recruitment of more transcription factors, the binding of which is reflected in the appearance of DNase I HS in the ETCM region. In early pro-B cells, before the activation of VpreB1 and λ5 transcription, the region forms a center for the recruitment of PU.1 and general transcription factors, and the rest of the locus becomes less permissive for factor binding. At the pre-B-cell stage, the epigenetically modified region expands, and additional transcription factor complexes and Pol II are recruited to the entire λ5-VpreB1 domain. The binding of E2A is likely to be important for the generation of the active epigenetic state of the locus. This process leads to the activation of the VpreB1 and λ5 promoters.

References

    1. Akashi, K., D. Traver, T. Miyamoto, and I. L. Weissman. 2000. A clonogenic common myeloid progenitor that gives rise to all myeloid lineages. Nature 404:193-197. - PubMed
    1. Anderson, M. K., G. Hernandez-Hoyos, R. A. Diamond, and E. V. Rothenberg. 1999. Precise developmental regulation of Ets family transcription factors during specification and commitment to the T cell lineage. Development 126:3131-3148. - PubMed
    1. Anguita, E., J. Hughes, C. Heyworth, G. A. Blobel, W. G. Wood, and D. R. Higgs. 2004. Globin gene activation during haemopoiesis is driven by protein complexes nucleated by GATA-1 and GATA-2. EMBO J. 23:2841-2852. - PMC - PubMed
    1. Anguita, E., C. A. Johnson, W. G. Wood, B. M. Turner, and D. R. Higgs. 2001. Identification of a conserved erythroid specific domain of histone acetylation across the alpha-globin gene cluster. Proc. Natl. Acad. Sci. USA 98:12114-12119. - PMC - PubMed
    1. Besse, S., M. Vigneron, E. Pichard, and F. Puvion-Dutilleul. 1995. Synthesis and maturation of viral transcripts in herpes simplex virus type 1 infected HeLa cells: the role of interchromatin granules. Gene Expr. 4:143-161. - PMC - PubMed

Publication types

MeSH terms

LinkOut - more resources