Testosterone and estradiol regulate free insulin-like growth factor I (IGF-I), IGF binding protein 1 (IGFBP-1), and dimeric IGF-I/IGFBP-1 concentrations
- PMID: 15713723
- PMCID: PMC1289262
- DOI: 10.1210/jc.2004-1314
Testosterone and estradiol regulate free insulin-like growth factor I (IGF-I), IGF binding protein 1 (IGFBP-1), and dimeric IGF-I/IGFBP-1 concentrations
Abstract
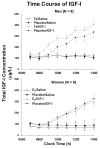
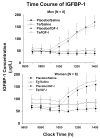
The present study tests the clinical postulate that elevated testosterone (Te) and estradiol (E2) concentrations modulate the effects of constant iv infusion of saline vs. recombinant human IGF-I on free IGF-I, IGF binding protein (IGFBP)-1, and dimeric IGF-I/IGFBP-1 concentrations in healthy aging adults. To this end, comparisons were made after administration of placebo (Pl) vs. Te in eight older men (aged 61 +/- 4 yr) and after Pl vs. E2 in eight postmenopausal women (62 +/- 3 yr). In the saline session, E2 lowered and Te increased total IGF-I; E2 specifically elevated IGFBP-1 by 1.5-fold and suppressed free IGF-I by 34%; and E2 increased binary IGF-I/IGFBP-1 by 5-fold more than Te. During IGF-I infusion, the following were found: 1) total and free IGF-I rose 1.4- to 2.0-fold (Pl) and 2.1-2.5-fold (Te) more rapidly in men than women; 2) binary IGF-I/IGFBP-1 increased 3.4-fold more rapidly in men (Te) than women (E2); and 3) end-infusion free IGF-I was 1.6-fold higher in men than women. In summary, E2, compared with Te supplementation, lowers concentrations of total and ultrafiltratably free IGF-I and elevates those of IGFBP-1 and binary IGF-I/IGFBP-1, thus putatively limiting IGF-I bioavailability. If free IGF-I mediates certain biological actions, then exogenous Te and E2 may modulate the tissue effects of total IGF-I concentrations unequally.
Figures


Similar articles
-
Effects of GH and/or sex steroids on circulating IGF-I and IGFBPs in healthy, aged women and men.Am J Physiol Endocrinol Metab. 2006 May;290(5):E1006-13. doi: 10.1152/ajpendo.00166.2005. Epub 2006 Jan 3. Am J Physiol Endocrinol Metab. 2006. PMID: 16390864 Clinical Trial.
-
Unequal impact of short-term testosterone repletion on the somatotropic axis of young and older men.J Clin Endocrinol Metab. 2002 Feb;87(2):825-34. doi: 10.1210/jcem.87.2.8222. J Clin Endocrinol Metab. 2002. PMID: 11836328 Clinical Trial.
-
Free IGF-I, IGFBP-1, and the binary complex of IGFBP-1 and IGF-I are increased during human pregnancy.Horm Res. 2004;62(5):215-20. doi: 10.1159/000081246. Epub 2004 Oct 1. Horm Res. 2004. PMID: 15467298
-
Circulating levels of insulin-like growth factors, their binding proteins, and breast cancer risk.Cancer Epidemiol Biomarkers Prev. 2005 Mar;14(3):699-704. doi: 10.1158/1055-9965.EPI-04-0561. Cancer Epidemiol Biomarkers Prev. 2005. PMID: 15767352
-
Dietary determinants of circulating insulin-like growth factor (IGF)-I and IGF binding proteins 1, -2 and -3 in women in the Netherlands.Cancer Causes Control. 2004 Oct;15(8):787-96. doi: 10.1023/B:CACO.0000043429.51915.c6. Cancer Causes Control. 2004. PMID: 15456992
Cited by
-
Bodyweight influences the relationship between serum testosterone and bone mineral density in men with spinal cord injury.Spinal Cord. 2024 Oct;62(10):555-561. doi: 10.1038/s41393-024-01022-4. Epub 2024 Jul 29. Spinal Cord. 2024. PMID: 39080393
-
IGF-binding protein 1 and abdominal obesity in the development of type 2 diabetes in women.Eur J Endocrinol. 2010 Aug;163(2):233-42. doi: 10.1530/EJE-10-0301. Epub 2010 May 27. Eur J Endocrinol. 2010. PMID: 20508082 Free PMC article.
-
Changes in serum collagen markers, IGF-I, and knee joint laxity across the menstrual cycle.J Orthop Res. 2012 Sep;30(9):1405-12. doi: 10.1002/jor.22093. Epub 2012 Mar 2. J Orthop Res. 2012. PMID: 22389002 Free PMC article.
-
Do Popular Diets Impact Fertility?Nutrients. 2024 May 31;16(11):1726. doi: 10.3390/nu16111726. Nutrients. 2024. PMID: 38892663 Free PMC article. Review.
-
Effect of GH/IGF-1 on Bone Metabolism and Osteoporsosis.Int J Endocrinol. 2014;2014:235060. doi: 10.1155/2014/235060. Epub 2014 Jul 23. Int J Endocrinol. 2014. PMID: 25147565 Free PMC article. Review.
References
-
- Finkelstein JW, Roffwarg HP, Boyar RM, Kream J, Hellman L. Age-related change in the twenty-four-hour spontaneous secretion of growth hormone. J Clin Endocrinol Metab. 1972;35:665–670. Ref ID: 119100. - PubMed
-
- Zadik Z, Chalew SA, McCarter RJ, Jr, Meistas M, Kowarski AA. The influence of age on the 24-hour integrated concentration of growth hormone in normal individuals. J Clin Endocrinol Metab. 1985;60:513–516. Ref ID: 2610. - PubMed
-
- Corpas E, Harman SM, Blackman MR. Human growth hormone and human aging. Endocr Rev. 1993;14:20–39. Ref ID: 5617. - PubMed
-
- De Boer H, Blok G-J, van der Veen E. Clinical aspects of growth hormone deficiency in adults. Endo Rev. 1995;16:63–86. Ref ID: 118672. - PubMed
-
- Blum WF, Shavrikova EP, Edwards DJ, Rosilio M, Hartman ML, Marin F, Valle D, van der Lely AJ, Attanasio AF, Strassburger CJ, Henrich G, Herschbach P. Decreased quality of life in adult patients with growth hormone deficiency compared with general populations using the new, validated, self-weighted questionnaire, questions on life satisfaction hypopituitarism module. J Clin Endocrinol Metab. 2003;88:4158–4167. Ref ID: 128270. - PubMed
Publication types
MeSH terms
Substances
Grants and funding
LinkOut - more resources
Full Text Sources
Other Literature Sources
Research Materials

