. 2005 Jun 15;388(Pt 3):895-903.
doi: 10.1042/BJ20041963.

Characterization of the inactivation of rat fatty acid synthase by C75: inhibition of partial reactions and protection by substrates

Affiliations

Characterization of the inactivation of rat fatty acid synthase by C75: inhibition of partial reactions and protection by substrates

Alan R Rendina et al. Biochem J. .

Abstract

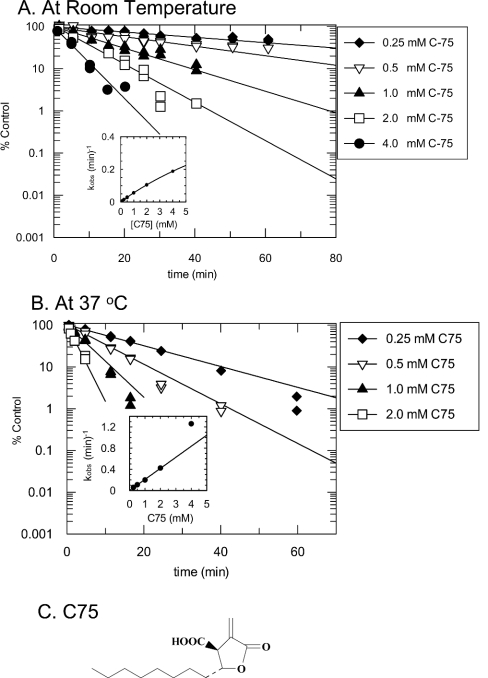
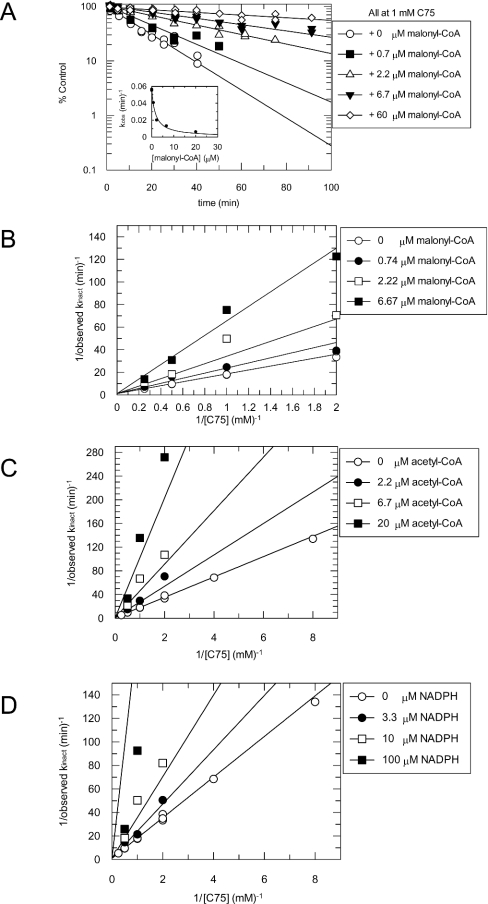
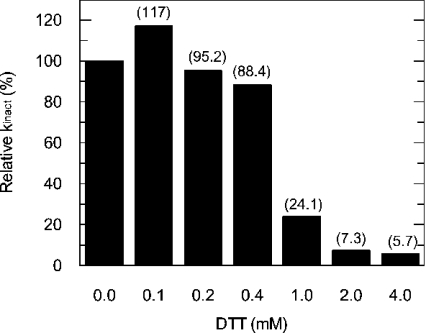
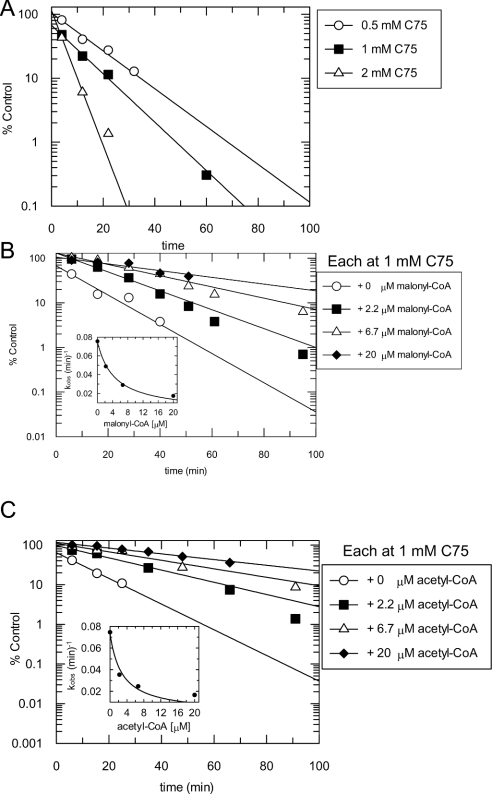
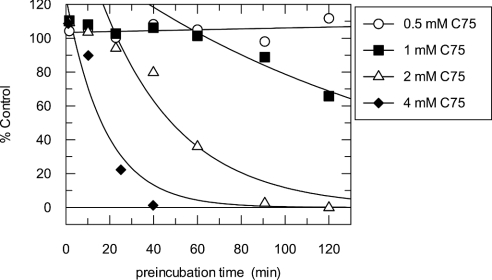
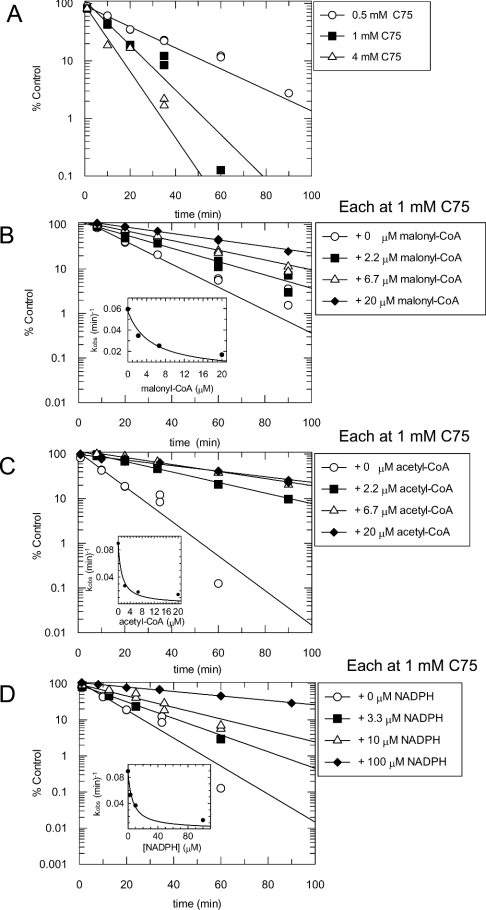
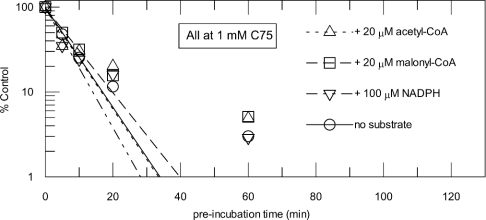
C75, a synthetic inhibitor of FAS (fatty acid synthase), has both anti-tumour and anti-obesity properties. In this study we provide a detailed kinetic characterization of the mechanism of in vitro inhibition of rat liver FAS. At room temperature, C75 is a competitive irreversible inhibitor of the overall reaction with regard to all three substrates, i.e. acetyl-CoA, malonyl-CoA and NADPH, exhibiting pseudo-first-order kinetics of the complexing type, i.e. a weak non-covalent enzyme-inhibitor complex is formed before irreversible enzyme modification. C75 is a relatively inefficient inactivator of FAS, with a maximal rate of inactivation of 1 min(-1) and an extrapolated K(I) (dissociation constant for the initial complex) of approx. 16 mM. The apparent second-order rate constants calculated from these values are 0.06 mM(-1).min(-1) at room temperature and 0.21 mM(-1).min(-1) at 37 degrees C. We also provide experimental evidence that C75 inactivates the beta-ketoacyl synthase (3-oxoacyl synthase) partial activity of FAS. Unexpectedly, C75 also inactivates the enoyl reductase and thioesterase partial activities of FAS with about the same rates as for inactivation of the beta-ketoacyl synthase. In contrast with the overall reaction, the beta-ketoacyl synthase activity and the enoyl reductase activity, substrates do not protect the thioesterase activity of rat liver FAS from inactivation by C75. These results differentiate inactivation by C75 from that by cerulenin, which only inactivates the beta-ketoacyl synthase activity of FAS, by forming an adduct with an active-site cysteine. Interference by dithiothreitol and protection by the substrates, acetyl-CoA, malonyl-CoA and NADPH, further distinguish the mechanism of C75-mediated inactivation from that of cerulenin. The most likely explanation for the multiple effects observed with C75 on rat liver FAS and its partial reactions is that there are multiple sites of interaction between C75 and FAS.


Figures

Figure 1
Figure 1. Kinetics of the inactivation by C75 of the overall FAS reaction at room temperature (A) and at 37 °C (B)
FAS (0.25 mg/ml; ∼0.9 μM active sites) and C75 at concentrations of 0.25 mM (◆), 0.5 mM (▽), 1 mM (▲), 2 mM (□) and 4 mM (●) were incubated at room temperature or at 37 °C in a 100 μl inactivation reaction mixture containing 4% (v/v) DMSO in 0.1 M potassium phosphate buffer, pH 7.0, in one column of wells of a V-bottomed polypropylene 96-well plate. At different times of the inactivation reaction, a 4 μl aliquot from the reaction column was diluted 1:50 (v/v) into duplicate columns of assay mixtures in a clear polystyrene 96-well plate containing 100 μM NADPH, 60 μM malonyl-CoA and 20 μM acetyl-CoA in 0.1 M potassium phosphate buffer, pH 7.0, pre-equilibrated at room temperature. The overall FAS reactions were monitored as described in the Experimental section. Activity (% of control) was calculated relative to that in 4% (v/v) DMSO. Lines are fits of the data to a single exponential. The insets show replots of the observed rate constants against C75 concentration, with the line fitted to a hyperbolic equation (eqn 2) for (A) and to a linear equation for (B). (C) Structure of C75.
Figure 2
Figure 2. Competition between C75 and malonyl-CoA, acetyl-CoA and NADPH
(A) Protection of FAS by malonyl-CoA from inactivation by 1 mM C75. Aliquots of FAS were preincubated with 1 mM C75 as described in Figure 1(A). During the incubation, malonyl-CoA was added to the mixture at concentrations of 0 μM (○), 0.7 μM (■), 2.2 μM (△), 6.7 μM (▼) and 60 μM (◇). Lines are fits of the data to a single exponential. The inset shows a replot of the observed rate constants against malonyl-CoA concentration, with a fit of the data for competition at a single concentration of inactivator (eqn 3). In (B)–(D), for the Kitz–Wilson analyses, aliquots of FAS (0.25 mg/ml; ∼0.9 μM active sites) were mixed with various concentrations of C75 (0, 0.125, 0.25, 0.5, 1, 2 and 4 mM). To each of the C75/FAS inactivation reaction mixtures for competition analyses, various substrate concentrations were added as follows: (B) malonyl-CoA [0 μM (○), 0.74 μM (●), 2.22 μM (□), 6.67 μM (■)]; (C) acetyl-CoA [0 μM (○), 2.2 μM (●), 6.67 μM (□), 20 μM (■)]; (D) NADPH [0 μM (○), 3.3 μM (●), 10 μM (□), 100 μM (■)]. Lines in (B)–(D) are global fits of the data at multiple substrate and inhibitor concentrations to eqn (1).
Figure 3
Figure 3. Prevention by DTT of inactivation of FAS by C75
FAS inactivation reactions were set up as described for Figure 1(A). In addition to 1 mM C75 in 4% DMSO (v/v), various concentrations of DTT (0, 0.1, 0.2, 0.4, 1, 2 and 4 mM) were added to each set of inactivation reactions. The C75 inactivation kinetics were analysed and the relative kinact plotted against DTT concentration (in this experiment at 0 mM DTT and 1 mM C75, kinact=0.07 min−1). Numbers in parentheses are the relative kinact expressed as a percentage of the control rate with no DTT at 1 mM C75.
Figure 4
Figure 4. Inactivation of the β-ketoacyl synthase partial activity of FAS by C75, and protection by malonyl-CoA and acetyl-CoA
(A) Inactivation reactions containing FAS (0.21 mg/ml enzyme and <50 μM DTT; ∼0.8 μM active sites) and various concentrations of C75 [0.5 mM (○), 1 mM (■) and 2 mM (△)] were set up in 0.1 M potassium phosphate buffer, pH 7.0. At different times, 18 μl of a mixture of acetyl-CoA (40 μM final) and malonyl-CoA (150 μM final) was added to 382 μl of inactivation reaction mixture pre-equilibrated at room temperature in five quartz 1-cm pathlength cuvettes, and the formation of the lactone was monitored at 283 nm to assess β-ketoacyl synthase activity. For substrate protection experiments, inactivation reactions and β-ketoacyl synthase assays were carried out as described in (A), except that malonyl-CoA (B) or acetyl-CoA (C) was added to the inactivation reactions at a concentration of 0 μM (○), 2.2 μM (■), 6.7 μM (△) or 20 μM (◆). Activity (% of control) was calculated relative to that in 4% (v/v) DMSO. Lines shown are fits of the data to a single exponential. The insets to (B) and (C) show replots of the observed rate constants against protectant concentration, with lines fitted to eqn (3) for competition at a single concentration of inactivator.
Figure 5
Figure 5. Inactivation of the β-ketoacyl reductase partial activity of FAS by C75
FAS (0.8 mg/ml and <20 μM DTT; ∼3 μM active sites) and C75 at concentrations of 0.5 mM (○), 1 mM (■), 2 mM (△) and 4 mM (◆) were incubated at room temperature in a 100 μl inactivation reaction mixture containing 4% (v/v) DMSO in 0.1 M potassium phosphate buffer, pH 7.0, in one column of wells of a V-bottomed polypropylene 96-well plate. At different times of the inactivation reaction, a 7 μl aliquot from the reaction column was diluted 1:30 (v/v) into duplicate columns of assay mixtures for the β-ketoacyl reductase reactions, as described in the Experimental section. Plots of activity as % of control (no C75) against preincubation time are shown in linear–linear format using the average of duplicate determinations to emphasize the lag phase. Activity (% of control) was calculated relative to that in 4% (v/v) DMSO. Lines are fits of the data after the lag period to a single exponential.
Figure 6
Figure 6. Inactivation of the enoyl reductase partial activity of FAS by C75, and protection by substrates
(A) Inactivation reactions containing rat liver FAS (0.8 mg/ml enzyme and <200 μM DTT; ∼3 μM active sites) and various concentrations of C75 [0.5 mM (○), 1 mM (■) and 4 mM (△)] were incubated at room temperature in a 100 μl inactivation reaction mixture containing 4% (v/v) DMSO in 0.1 M potassium phosphate buffer, pH 7.0, in one column of wells of a V-bottomed polypropylene 96-well plate. At different times of the inactivation reaction, a 10 μl aliquot from the reaction column was diluted 1:20 (v/v) into duplicate columns of assay mixtures for the enoyl reductase reactions, as described in the Experimental section. For substrate protection experiments, inactivation reactions and enoyl reductase assays were carried out as described in (A), except that malonyl-CoA (B), acetyl-CoA (C) or NADPH (D) was added to the inactivation reactions at concentrations of 0 μM (○), 2.2 μM (■), 6.7 μM (△) and 20 μM (◆) for the CoA substrates, and 0 μM (○), 3.3 μM (■), 10 μM (△) and 100 μM (◆) for NADPH. Activity (% of control) was calculated relative to that in 4% (v/v) DMSO. Lines shown are to fits of the data to a single exponential. The insets to (B)–(D) are replots of the observed rate constants against the protectant concentration, with lines fitted to eqn (3) for competition at a single concentration of inactivator.
Figure 7
Figure 7. Inactivation of the thioesterase reaction by 1 mM C75
Inactivation reactions containing FAS (0.2 mg/ml and <50 μM DTT; ∼0.8 μM active sites) and the indicated concentrations of C75 and substrates were incubated at room temperature in 0.1 M potassium phosphate buffer, pH 7.0. At various time points, 100 μl aliquots were delivered to the thioesterase reaction mixture containing 100 mM potassium phosphate and 10 μM [1-14C]palmitoyl-CoA (3 Ci/mol; NEN) in a total volume of 500 μl. After incubation at room temperature for 2 min, the reactions were terminated by the addition of 0.1 ml of 10% (v/v) H2SO4 and analysed as described in the Experimental section. Data are for the addition of no substrate (○), 20 μM malonyl-CoA (□), 20 μM acetyl-CoA (△) or 100 μM NADPH (▽) at 1 mM C75. Activity (% of control) is calculated relative to the zero time data.

Similar articles

Cited by

References

    1. Wakil S. J. Fatty acid synthase, a proficient multifunctional enzyme. Biochemistry. 1989;28:4523–4530. - PubMed
    1. Smith S., Witkowski A., Joshi A. K. Structure and functional organization of the animal fatty acid synthase. Prog. Lipid Res. 2003;42:289–317. - PubMed
    1. Kuhajda F. P., Pizer E. S., Li J. N., Mani N. S., Frehywot G. L., Townsend C. A. Synthesis and antitumor activity of an inhibitor of fatty acid synthase. Proc. Natl. Acad. Sci. U.S.A. 2000;97:3450–3454. - PMC - PubMed
    1. Pizer E. S., Thupari J., Han W. F., Pinn M. L., Chrest F. J., Frehywot G. L., Townsend C. A., Kuhajda F. P. Malonyl-coenzyme-A is a potential mediator of cytotoxicity induced by fatty-acid synthase inhibition in human breast cancer cells and xenografts. Cancer Res. 2000;60:213–218. - PubMed
    1. Loftus T. M., Jaworsky D. E., Frehywot G. L., Townsend C. A., Ronnett G. V., Lane M. D., Kuhajda F. P. Reduced food intake and body weight in mice treated with fatty acid synthase inhibitors. Science. 2000;288:2379–2381. - PubMed

MeSH terms