

mRNA sequence features that contribute to translational regulation in Arabidopsis
- PMID: 15716313
- PMCID: PMC549406
- DOI: 10.1093/nar/gki240
mRNA sequence features that contribute to translational regulation in Arabidopsis
Abstract
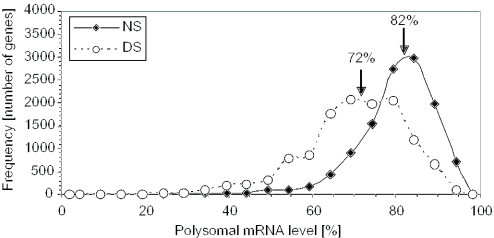
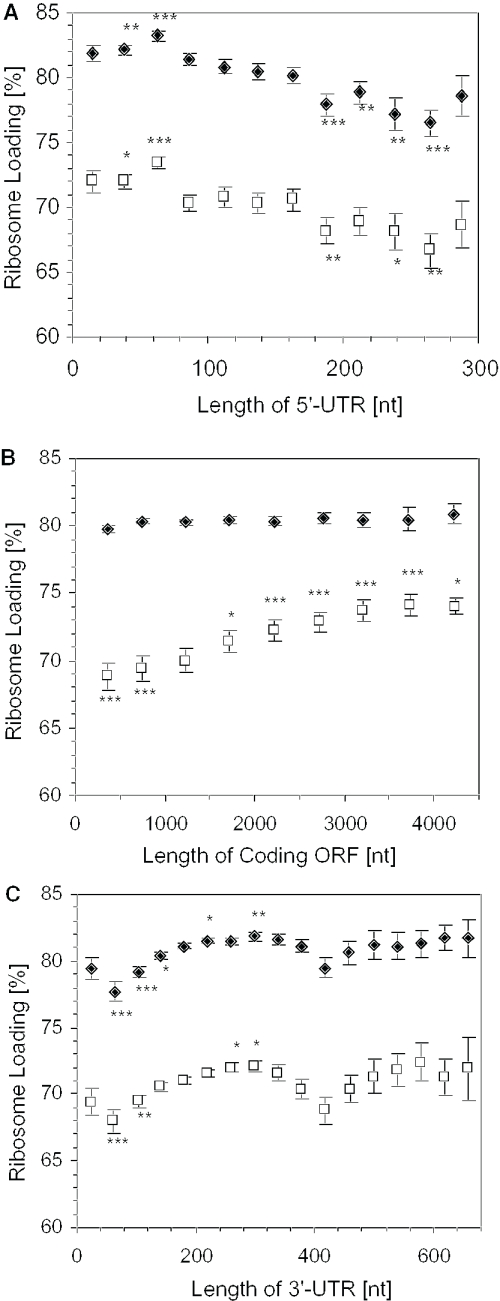
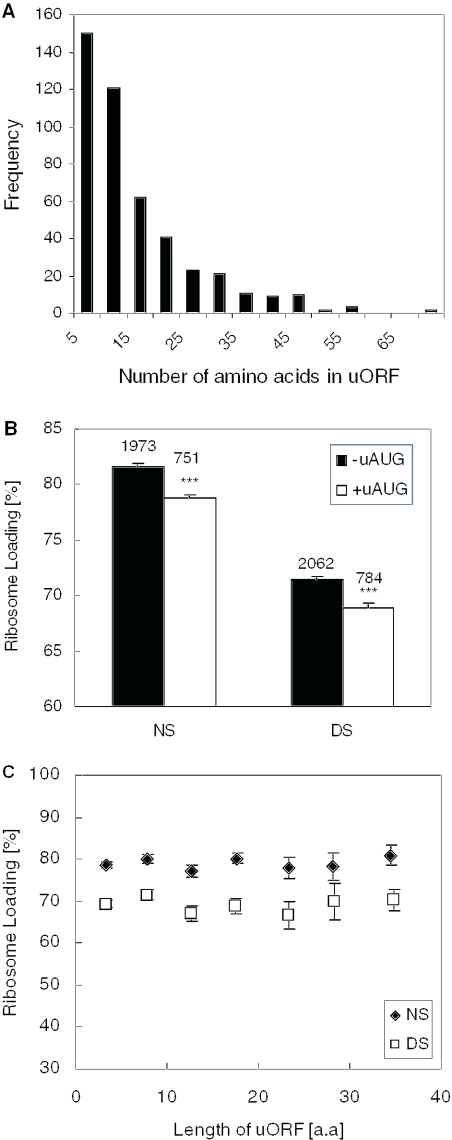
DNA microarrays were used to evaluate the regulation of the proportion of individual mRNA species in polysomal complexes in leaves of Arabidopsis thaliana under control growth conditions and following a mild dehydration stress (DS). The analysis determined that the percentage of an individual gene transcript in polysomes (ribosome loading) ranged from over 95 to <5%. DS caused a decrease in ribosome loading from 82 to 72%, with maintained polysome association for over 60% of the mRNAs with an increased abundance. To identify sequence features responsible for translational regulation, ribosome loading values and features of full-length mRNA sequences were compared. mRNAs with extreme length or high GU content in the 5'-untranslated regions (5'-UTRs) were generally poorly translated. Under DS, mRNAs with both a high GC content in the 5'-UTR and long open reading frame showed a significant impairment in ribosome loading. Evaluation of initiation A+1UG codon context revealed distinctions in the frequency of adenine in nucleotides -10 to -1 (especially at -4 and -3) in mRNAs with different ribosome loading values. Notably, the mRNA features that contribute to translational regulation could not fully explain the variation in ribosome loading, indicating that additional factors contribute to translational regulation in Arabidopsis.
Figures


Similar articles
-
Changes in Polysome Association of mRNA Throughout Growth and Development in Arabidopsis thaliana.Plant Cell Physiol. 2015 Nov;56(11):2169-80. doi: 10.1093/pcp/pcv133. Epub 2015 Sep 26. Plant Cell Physiol. 2015. PMID: 26412777
-
Translational dynamics revealed by genome-wide profiling of ribosome footprints in Arabidopsis.Proc Natl Acad Sci U S A. 2014 Jan 7;111(1):E203-12. doi: 10.1073/pnas.1317811111. Epub 2013 Dec 23. Proc Natl Acad Sci U S A. 2014. PMID: 24367078 Free PMC article.
-
Differential mRNA translation contributes to gene regulation under non-stress and dehydration stress conditions in Arabidopsis thaliana.Plant J. 2004 Jun;38(5):823-39. doi: 10.1111/j.1365-313X.2004.02090.x. Plant J. 2004. PMID: 15144383
-
Plastid mRNA translation.Methods Mol Biol. 2014;1132:73-91. doi: 10.1007/978-1-62703-995-6_4. Methods Mol Biol. 2014. PMID: 24599847 Review.
-
Control of eukaryotic protein synthesis by upstream open reading frames in the 5'-untranslated region of an mRNA.Biochem J. 2002 Oct 1;367(Pt 1):1-11. doi: 10.1042/BJ20011706. Biochem J. 2002. PMID: 12117416 Free PMC article. Review.
Cited by
-
Posttranscriptional control of photosynthetic mRNA decay under stress conditions requires 3' and 5' untranslated regions and correlates with differential polysome association in rice.Plant Physiol. 2012 Jul;159(3):1111-24. doi: 10.1104/pp.112.194928. Epub 2012 May 7. Plant Physiol. 2012. PMID: 22566494 Free PMC article.
-
Plant translational reprogramming for stress resilience.Front Plant Sci. 2023 Feb 24;14:1151587. doi: 10.3389/fpls.2023.1151587. eCollection 2023. Front Plant Sci. 2023. PMID: 36909402 Free PMC article. Review.
-
Global signatures of protein and mRNA expression levels.Mol Biosyst. 2009 Dec;5(12):1512-26. doi: 10.1039/b908315d. Epub 2009 Oct 1. Mol Biosyst. 2009. PMID: 20023718 Free PMC article. Review.
-
Translational Regulation of Cytoplasmic mRNAs.Arabidopsis Book. 2013 Jul 18;11:e0165. doi: 10.1199/tab.0165. Print 2013. Arabidopsis Book. 2013. PMID: 23908601 Free PMC article.
-
Zinc triggers a complex transcriptional and post-transcriptional regulation of the metal homeostasis gene FRD3 in Arabidopsis relatives.J Exp Bot. 2015 Jul;66(13):3865-78. doi: 10.1093/jxb/erv188. Epub 2015 Apr 21. J Exp Bot. 2015. PMID: 25900619 Free PMC article.
References
-
- Carter M.S., Kuhn K.M., Sarnow P. Cellular internal ribosome entry site elements and the use of cDNA microarrays in their investigation. In: Sonenberg N., Hershey J.W.B., Mathews M.B., editors. Translational Control of Gene Expression. NY: Cold Spring Harbor Laboratory Press; 2000. pp. 615–635.
-
- Diehn M., Eisen M.B., Botstein D., Brown P.O. Large-scale identification of secreted and membrane-associated gene products using DNA microarrays. Nature Genet. 2000;25:58–62. - PubMed
-
- Grolleau A., Bowman J., Pradet-Balade B., Puravs E., Hanash S., Garcia-Sanz J.A., Beretta L. Global and specific translational control by rapamycin in T cells uncovered by microarrays and proteomics. J. Biol. Chem. 2002;277:22175–22184. - PubMed
Publication types
MeSH terms
Substances
LinkOut - more resources
Full Text Sources
Other Literature Sources
Molecular Biology Databases
Miscellaneous
