Comparative Study
. 2005 Feb 16;25(7):1737-49.
doi: 10.1523/JNEUROSCI.2765-04.2005.

Gq/11-induced and spontaneous waves of coordinated network activation in developing frontal cortex

Affiliations
Comparative Study

Gq/11-induced and spontaneous waves of coordinated network activation in developing frontal cortex

D Paola Calderon et al. J Neurosci. .

Abstract

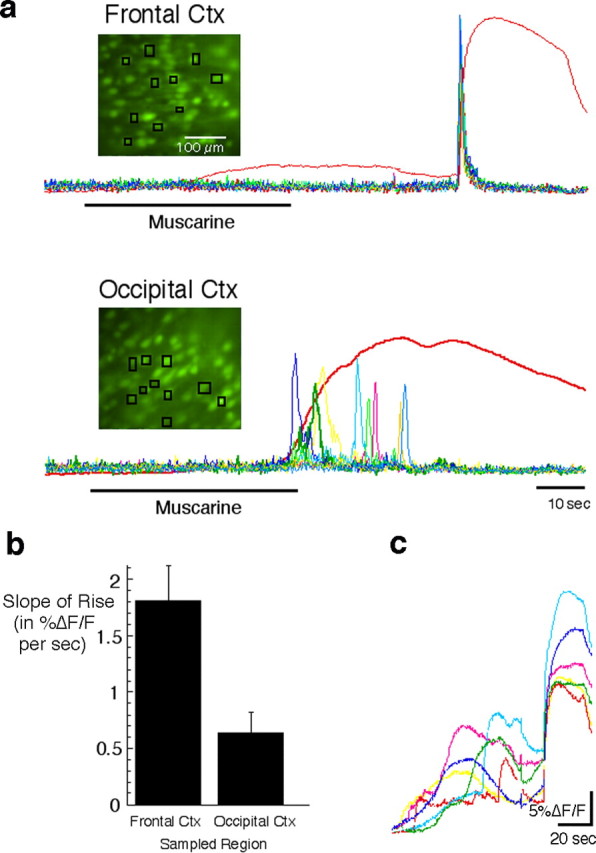
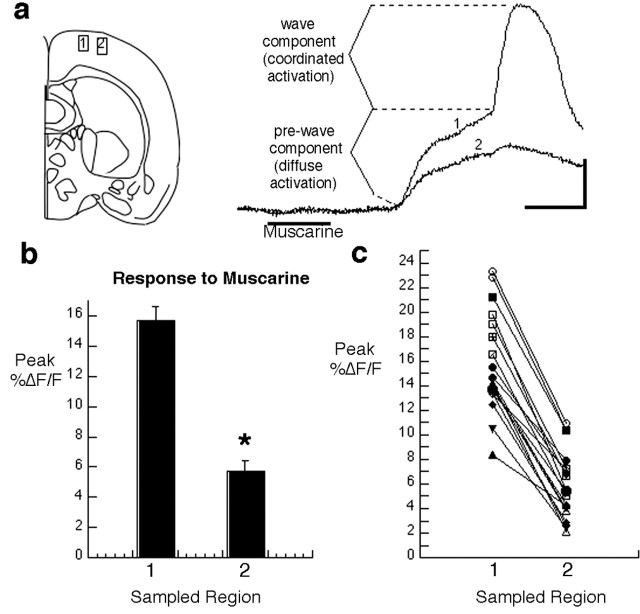
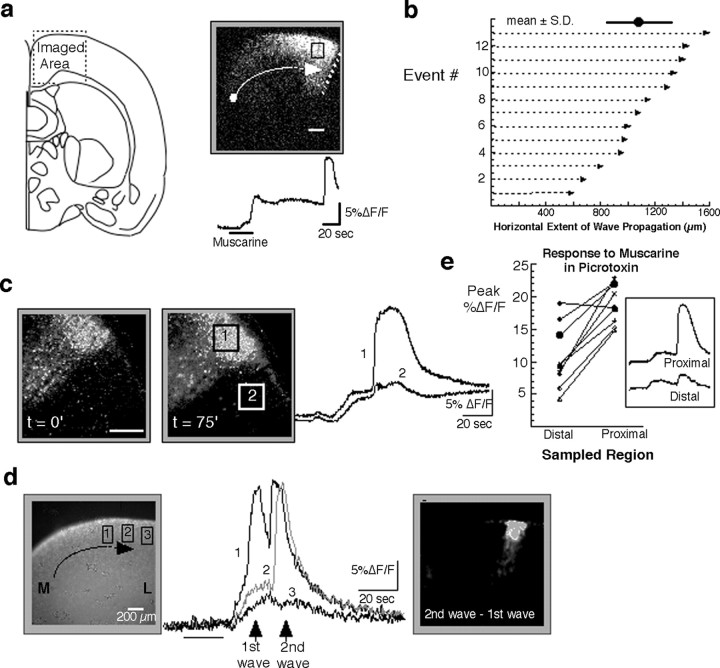
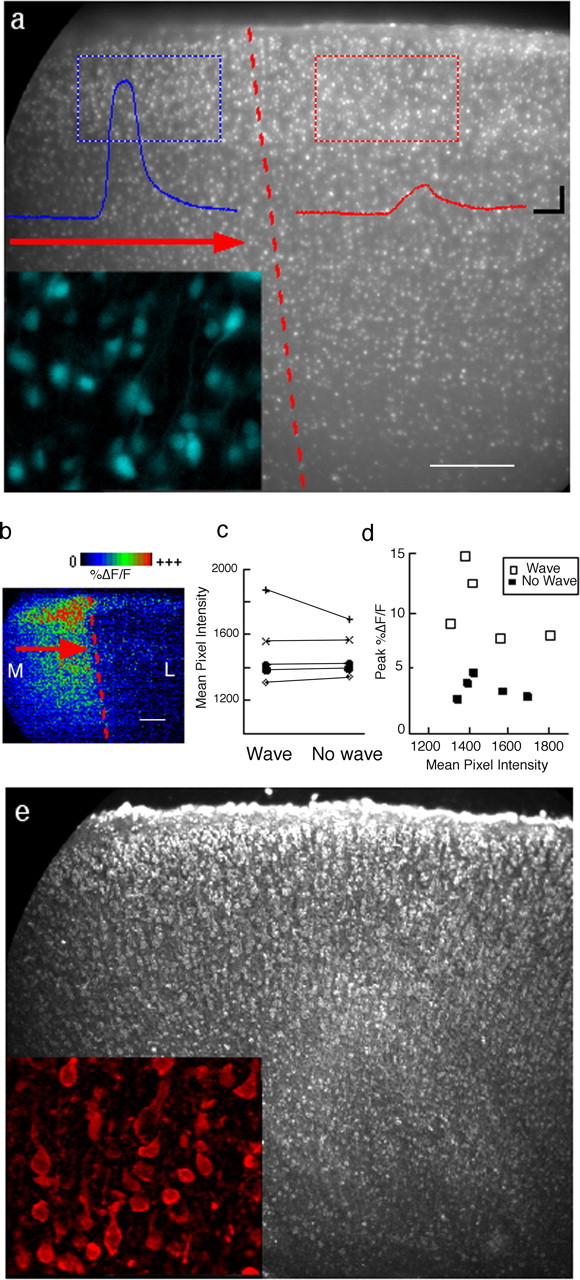
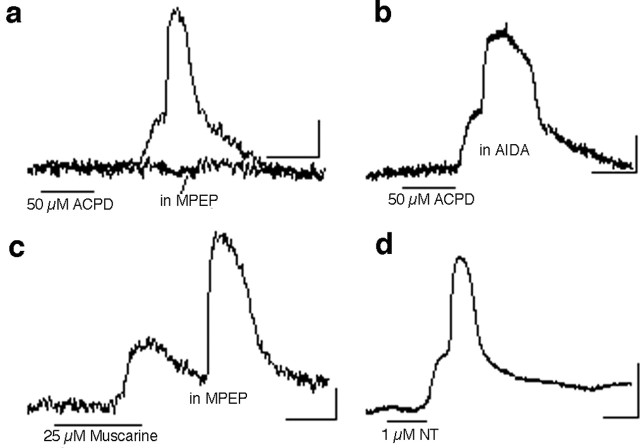
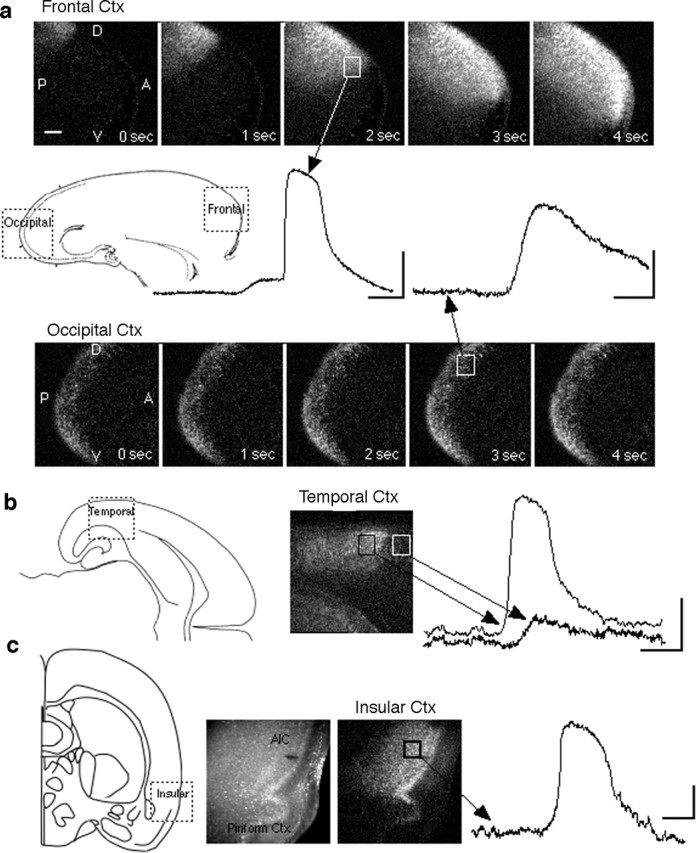
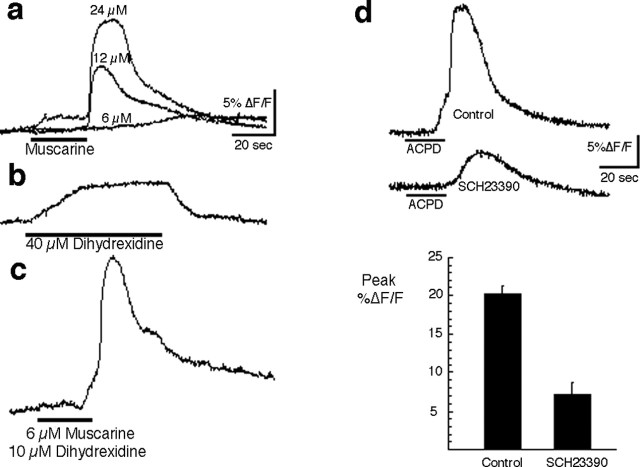
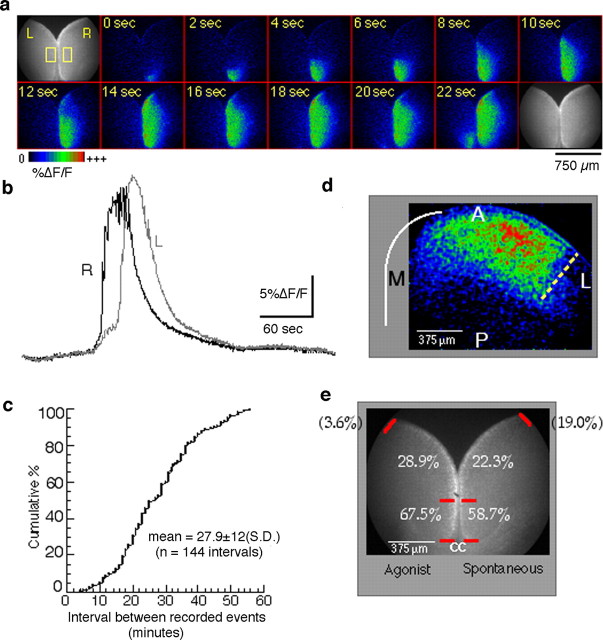
Repeated episodes of spontaneous large-scale neuronal bursting and calcium influx in the developing brain can potentially affect such fundamental processes as circuit formation and gene expression. Between postnatal day 3 (P3) and P7, the immature cortex can express one such form of activation whereby a wave of neuronal activity propagates through cortical networks, generating massive calcium influx. We previously showed that this activity could be triggered by brief stimulation of muscarinic receptors. Here, we show, by monitoring large cortical areas at low magnification, that although all areas respond to muscarinic agonists to some extent, only some areas are likely to generate the coordinated wave-like activation. The waves can be triggered repeatedly in frontal areas where, as we also show, waves occur spontaneously at a low frequency. In parietal and occipital areas, no such waves are seen. This selectivity may be related in part to differences in the cortical distribution of dopaminergic signaling, because we find that activation of dopamine receptors enables the response. Because M1 muscarinic receptors are typically coupled with G-alpha(q)/11, we investigated whether other receptors known to couple with this G-protein (group I glutamate metabotropic receptors, neurotensin type 1) could similarly elicit wave-like activation in responsive cortical areas. Our results suggest that multiple neurotransmitter systems can enable this form of activation in the frontal cortex. The findings suggest that a poorly recognized, developmentally regulated form of strong network activation found predominantly in the frontal cortex could potentially exert a profound influence on brain development.


Figures

Figure 6.
Figure 6.
Synchronized responses among neighboring neurons underlies the sudden, large-amplitude calcium signal in the frontal cortex (Ctx). a, Image sequences captured at high magnification were used to analyze the responses of individual neurons after muscarine (25 μm) application in P4-P7 slices. Images show the location of the multiple small regions from which cell responses were sampled. The red traces show the response time course averaged for all of the cells in the field of view. Other colored traces show the first derivative of the response for each of the cells sampled. The peak of each first derivative trace identifies the time of maximal rate of increase in [Ca2+]i. Note that the fast-rising signal in the frontal cortex is associated with single-cell responses that are synchronized, whereas the slower signal in the occipital cortex is attributable to variable timing in the response of single cells. b, Quantification of the difference in signal slope (%ΔF/F per second) in frontal and occipital areas (n = 11 and 10, respectively) reveals a threefold faster rise time in the frontal cortex (p < 0.006). c, The synchronized response of cells in the frontal cortex is usually preceded by smaller nonsynchronous responses. These nonsynchronous responses make up the slow, low-amplitude component in the population (spatially averaged) signals shown in all other figures.
Figure 1.
Figure 1.
Activation of developing cortical networks by muscarinic stimulation is stronger in a dorsomedial region of coronal slices. a, Schematic diagram of a coronal slice showing the location from which sample records at the right were obtained. The traces show the response to muscarine (25 μm at the time shown) at each of two regions of interest separated by 200 μm in a P4 slice. Each trace represents changes in calcium-dependent fura-2 fluorescence sampled at a region of interest that includes many cells. By moving the field of view progressively more lateral until the wave termination site was found, both types of responses could be examined simultaneously in adjacent regions. b, Grouped data from results like the one shown in a. Error bars represent values for the maximum percentage of change in fura-2 fluorescence from baseline to peak (mean ± SEM; n = 19 slices; P3-P7). *p < 0.0001 (Student's t test, paired data). c, Paired data for each individual experiment show that the difference between values is very consistent. Calibration: 20 s, 5%ΔF/F.
Figure 2.
Figure 2.
The distance over which waves propagate on the dorsal region of the cortex is variable. a, Spatial extent of a response recorded in the dorsal region of a P5 coronal slice, in the area shown on the left (for a description of image processing algorithms, see Materials and Methods, Analysis of calcium imaging). The dot and arrow represent the approximate initiation site and direction of propagation, respectively, of waves in this region. The dotted line marks the boundary of wave propagation. The black square is the region from which the trace (below) was obtained. b, The distance traveled by waves measured along the pial surface from initiation site to termination site in 13 different slices. The mean and SD are 1093 ± 304 μm (shown at the top). c, Example of termination site recorded for two events separated in time by 75 min in a P5 slice illustrates that the boundary can be both stable and sharp, as shown by the fluorescence traces taken from both sides of the boundary. Scale bar, 200 μm. d, An example in which the response to agonist consisted of two waves illustrates how the second wave propagates further (≈200 μm) than the first in a P4 slice. Traces show the activity at each of the three regions shown on the left image. M, Medial; L, lateral. e, Effect of blockade of GABAA receptor channels with picrotoxin (100 μm) on the response to agonist shows that differences in amplitude between regions proximal and distal to the boundary of wave propagation persist after GABAA blockade. Statistical significance of the difference in responsiveness is preserved in picrotoxin. Mean ± SEM of response at peak: 10.6 ± 1.6 (distal cortex) versus 18.9 ± 1.0 (proximal cortex). p < 0.0004 (t test, paired data).
Figure 3.
Figure 3.
Cell density and fura-2 loading are similar in areas that sustain wave activity and those that do not. a, Sample image of a fura-2-stained P4 slice illustrates the method used to assess cell density and dye loading in two neighboring subregions in the dorsal part of a coronal slice. Traces from the corresponding color-coded rectangular regions show the response of each region to bath-applied agonist. Note the absence of any obvious cyto architectonic boundary at the wave termination site. b, Processed image highlighting the extent of the area that responded to agonist with awave of activity in the region shown in a. c, Values of mean pixel intensity for pairs of regions from five slices (P3-P4). d, Peak %ΔF/F as a function of the mean pixel intensity for each of the 10 regions shown in c shows that differences in the amplitude of the response are not accounted for by differences in dye loading or cell density, both of which contribute to mean pixel intensity. e, Nissl-stained section from the same region as in a also shows that no clear cytoarchitectonic discontinuity is present at the site of wave termination. M, Medial; L, lateral. The red arrows show the direction of wave propagation. Scale bar, 200 μm. The insets in a and e show 6× higher magnification of stained cells with fura-2 and Nissl stain, respectively.
Figure 4.
Figure 4.
Other Gq/11-linked neurotransmitter receptors also trigger wave-like activation. The response to the group I/II mGluR agonist ACPD in the frontal cortex (a) is indistinguishable from the response to muscarine. The ACPD effect is blocked by the mGluR5 antagonist MPEP (2.5 μm; n = 3) (a) but not by the mGluR1 antagonist AIDA (200 μm; n = 3) (b). c, In the presence of MPEP, a muscarinic response can still be obtained, indicating that the more abundant glutamatergic system is not responsible for indirectly mediating the effect induced by muscarine. d, Activation of neurotensin (NT) receptors with neurotensin 8-13 also activates a synchronized network response. All records shown are from P4-P5 slices. Calibration: 5%ΔF/F, 20 s.
Figure 5.
Figure 5.
Examples from four additional cortical areas illustrate the dual nature of network responses to Gq/11-linked receptor stimulation. a, Example of the differential response in two areas, frontal and occipital, obtained in single sagittal P5 slices containing the entire anteroposterior extent of one hemisphere. Processed image sequences (described in Materials and Methods) illustrate the spatiotemporal characteristics of the response at 1 s intervals during the peak of the response in each area. In the occipital cortex (Ctx), the response occurs diffusely throughout the area; in the frontal cortex, in addition to the low-level diffuse response (not visible in the processed images), there is a wave of strong activation that propagates horizontally across the cortex. Scale bar, 200 μm. b, A response in the temporal cortex in a P4 horizontal slice. The trace derived from the white square shows response in a neighboring area presumed to be the parietal cortex. c, Example of a response in a P3 coronal slice recorded in the ventrolateral region, an area that contains the agranular insular cortex (AIC). The left image shows the raw fura-2 fluorescence; the right image is processed (see Materials and Methods) to highlight the spatial extent of the response at its peak. Calibration: 5%ΔF/F, 20 s.
Figure 7.
Figure 7.
Dopamine D1 receptors gate the activation induced through Gq/11-linked receptors. a, A subthreshold dose of muscarine was obtained by progressively lowering the muscarine concentration until the fast, large-amplitude component of the response could not be induced. b, A typical concentration of the D1 agonist dihydrexidine (40 μm) was then applied to the slice, and the response at the same site was recorded. The change in fluorescence recorded during perfusion of 40 μm dihydrexidine is probably a result of absorption by this compound at the fura-2 excitation or emission wavelengths, not because of a real calcium increase. c, Application of a reduced dihydrexidine concentration (10 μm) together with a subthreshold dose of muscarine acts synergistically with the subthreshold muscarine stimulus to induce strong network activation (P5 slice). d, Application of the D1 antagonist SCH23390 to the bath results in elimination of most of the response, suggesting that there is a basal level of D1 receptor stimulation in slices and that this is necessary for the response (n = 4 slices; P4-P5).
Figure 8.
Figure 8.
Spontaneous waves occur at low frequency in the frontal cortex in the absence of exogenous agonist. a, Example of a spontaneous wave in a horizontal P4 slice. The sequence of processed images shows activity propagation starting in the medial cortex of the hemisphere labeled “R,” near the CC (not visible). Only the first 22 s of this wave are shown. A wave in the hemisphere labeled “L” begins ∼20 s after the one in R. b, Traces from each of the two rectangular regions depicted on the first frame of a show the time course of the calcium signal. c, Data summarizing interevent intervals as inferred from multiple 12 min recordings on each of 23 slices. d, Extent of propagation of a spontaneous wave in the frontal cortex showing the lateral boundary (dotted line) in a P5 slice. A, Anterior; P, posterior; L, lateral; M, medial. e, Summary of initiation sites. The numbers refer to the percentage of waves initiating in each marked segment of the frontal cortex for agonist-induced (left) and spontaneous (right) waves recorded in different sets of slices. Waves originating outside the field of view are shown in parentheses.

Similar articles

Cited by

References

    1. Aksay E, Gamkrelidze G, Seung HS, Baker R, Tank DW (2001) In vivo intracellular recording and perturbation of persistent activity in a neural integrator. Nat Neurosci 4: 184-193. - PubMed
    1. Aosaki T, Kiuchi K, Kawaguchi Y (1998) Dopamine D1-like receptor activation excites rat striatal large aspiny neurons in vitro. J Neurosci 18: 5180-5190. - PMC - PubMed
    1. Ben-Ari Y (2001) Developing networks play a similar melody. Trends Neurosci 24: 353-360. - PubMed
    1. Ben-Ari Y, Cherubini E, Corradetti R, Gaiarsa JL (1989) Giant synaptic potentials in immature rat CA3 hippocampal neurones. J Physiol (Lond) 416: 303-325. - PMC - PubMed
    1. Bevilacqua JA, Downes CP, Lowenstein PR (1995) Transiently selective activation of phosphoinositide turnover in layer V pyramidal neurons after specific mGluRs stimulation in rat somatosensory cortex during early postnatal development. J Neurosci 15: 7916-7928. - PMC - PubMed

Publication types

MeSH terms

Substances

LinkOut - more resources