. 2005 Feb 16;25(7):1750-60.
doi: 10.1523/JNEUROSCI.4217-04.2005.

Activity-dependent long-term potentiation of intrinsic excitability in hippocampal CA1 pyramidal neurons

Affiliations

Activity-dependent long-term potentiation of intrinsic excitability in hippocampal CA1 pyramidal neurons

Jun Xu et al. J Neurosci. .

Abstract

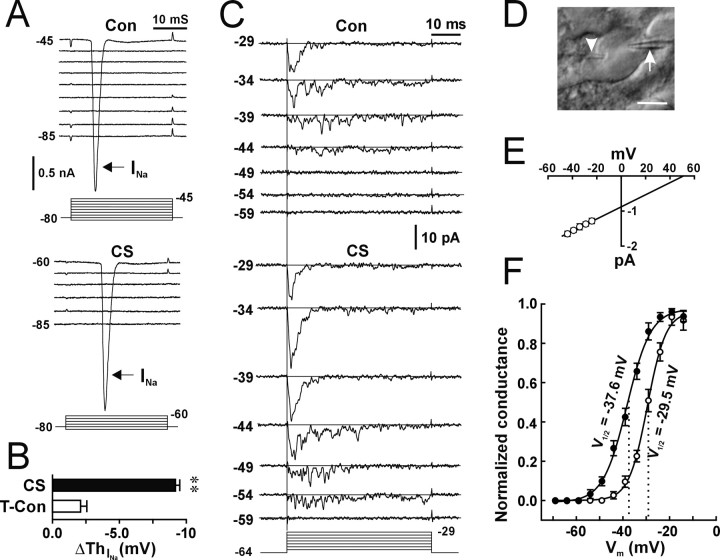
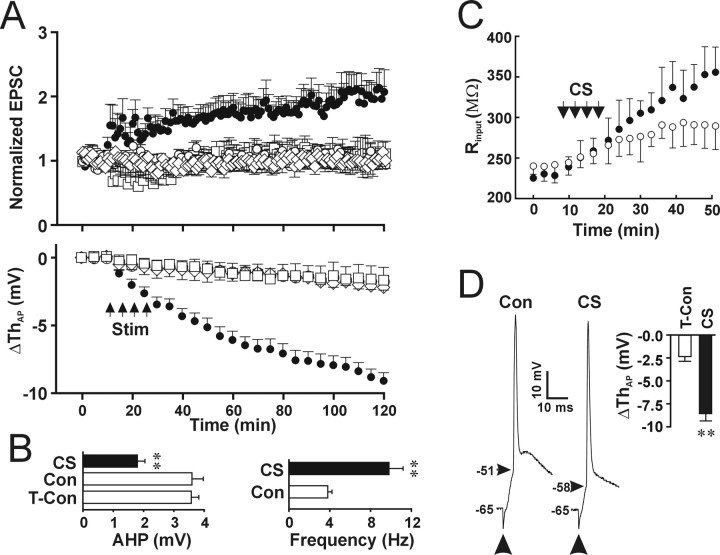
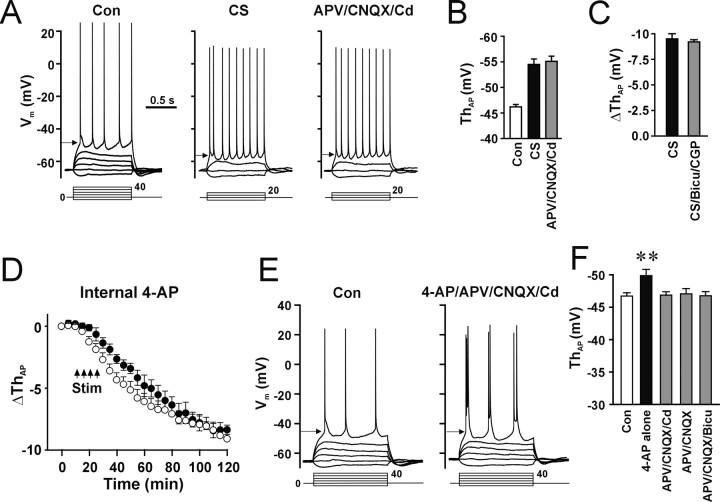
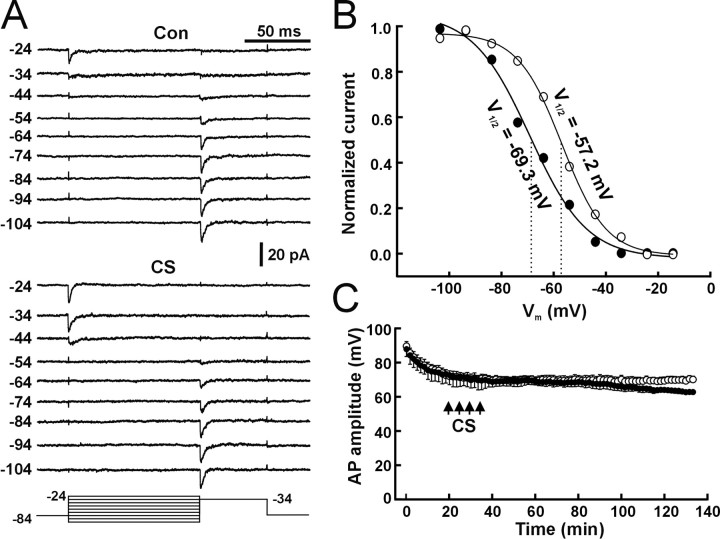
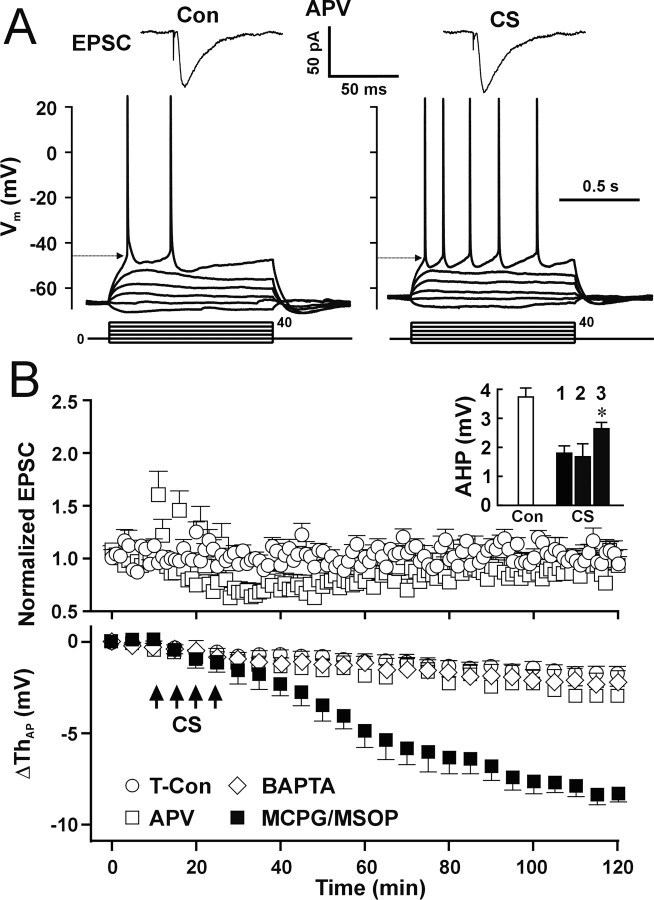
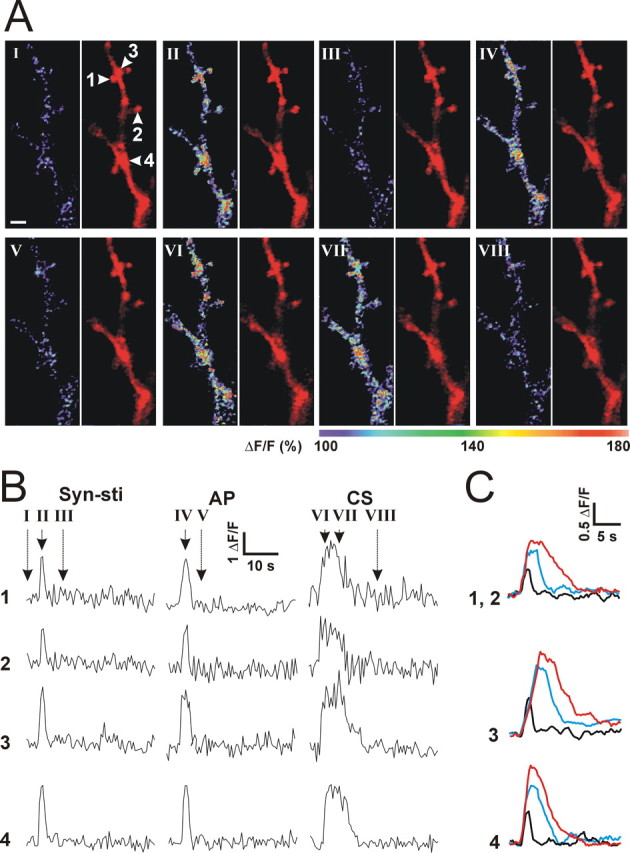
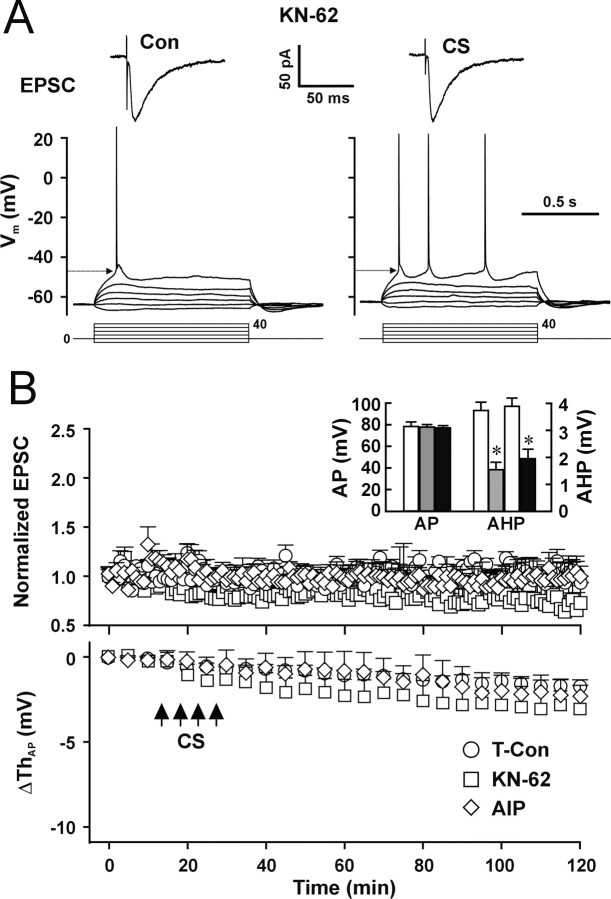
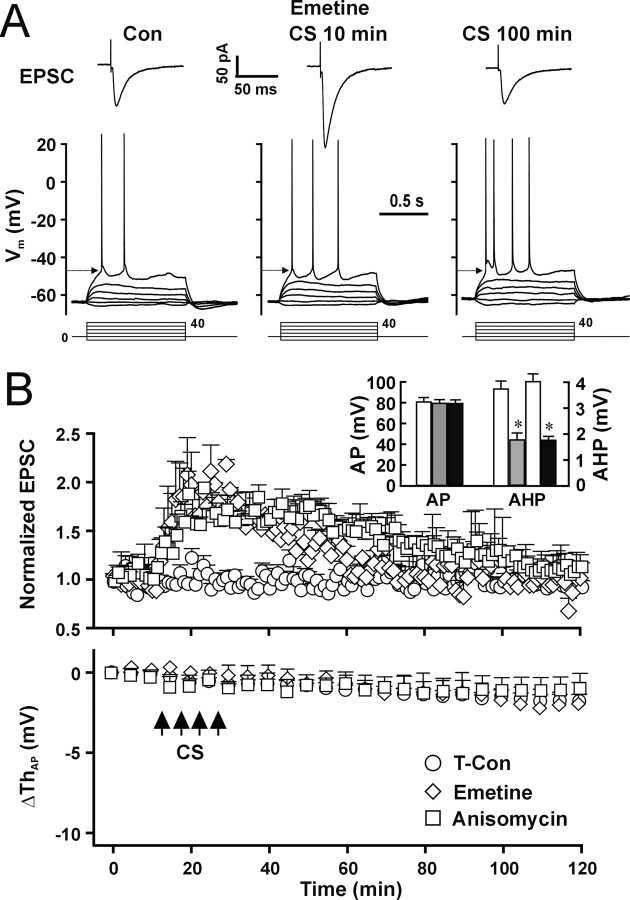
The efficiency of neural circuits is enhanced not only by increasing synaptic strength but also by increasing intrinsic excitability. In contrast to the detailed analysis of long-term potentiation (LTP), less attention has been given to activity-dependent changes in the intrinsic neuronal excitability. By stimulating hippocampal CA1 pyramidal neurons with synaptic inputs correlating with postsynaptic neuronal spikes, we elicited an LTP of intrinsic excitability (LTP-IE) concurring with synaptic LTP. LTP-IE was manifested as a decrease in the action potential threshold that was attributable to a hyperpolarized shift in the activation curve of voltage-gated sodium channels (VGSCs) rather than activity-dependent changes in synaptic inputs or A-type K+ channels. Cell-attached patch recording of VGSC activities indicated such an activity-dependent change in VGSCs. Induction of LTP-IE was blocked by the NMDA receptor antagonist APV, intracellular BAPTA, the CaM kinase inhibitors KN-62 and autocamtide-2-related inhibitory peptide, and the protein synthesis inhibitors emetine and anisomycin. The results suggest that induction of LTP-IE shares a similar signaling pathway with the late phase of synaptic LTP and requires activation of the NMDA glutamate receptor subtype, Ca2+ influx, activity of CaM kinase II, and function of the protein synthesis. This new form of hippocampal neuronal plasticity could be a cellular correlate of learning and memory besides synaptic LTP.


Figures

Figure 4.
Figure 4.
A hyperpolarized shift in the activation curve of VGSCs during induction of LTP-IE. A, Whole-cell voltage-clamp recordings from a representative cell showing the voltage-dependent activation of the Na+ current (INa, arrows) during control (Con) and 100 min after CS (CS). After CS, the depolarization step required to activate the INa became -60 mV. B, Summary of changes in the voltage-dependent activation of the INa (ΔThNa) from time control (open bar; n = 10 cells) and CS (filled bar; **p < 0.01; paired t test; n = 9 cells) experiments. C, A representative patch showing activities of fast and transient VGSC activities at different steps (left numbers in millivolts) before (Con) and 1 h after CS (CS). The bottom lines indicate the depolarization steps (in millivolts) delivered to the cell-attached patch. The straight line in each trace indicates baseline (closed state). D, A DIC image showing a whole-cell pipette (arrowhead) and a cell-attached pipette (arrow) on the soma of a pyramidal neuron. Scale bar, 10 μm. E, The I-V curve for unitary currents of control VGSCs (n = 8 patches). F, The activation curve of VGSCs during control (open circle) and after CS (filled circle). Normalized conductance was obtained through dividing the chord conductance by the maximal conductance. The data were fitted by the Boltzman equation. The numbers are V1/2 during control (right) and after CS (left). V1/2 is the voltage at which the chord conductance of VGSCs is at half of the maximum.
Figure 1.
Figure 1.
CS induced both synaptic LTP and neuronal LTP-IE. A, The intracellular Ca2+/EGTA ratio affects the stability of the AP threshold. The AP threshold changed as a function of recording time when a 0 mm Ca2+/0 mm EGTA (filled circle) or a 0 mm Ca2+/10 mm EGTA (filled square) pipette solution was used but was relatively stable when a 0.1 mm Ca2+/1 mm EGTA (open circle) or 1 mm Ca2+/10 mm EGTA (open diamond) pipette solution was used (n = 5 cells for each group). B, Protocol of CS. Top trace, A recording of synaptic EPSPs and APs evoked by 5 s of CS. An enlarged trace from the indicated period shows four EPSCs and APs. The two bottom lines correspond to the synaptic stimulation (Syn) and current injection (Cur) protocols. C, Whole-cell voltage-clamp (top traces) and current-clamp (bottom traces) recordings from a representative pyramidal neuron showing CS-induced synaptic LTP (top, EPSC) and gradually developed LTP-IE (bottom, arrows). Bottom lines, Injecting currents (in picoamperes). D, The time course of synaptic LTP (top) and LTP-IE (bottom).
Figure 2.
Figure 2.
Association of presynaptic inputs and postsynaptic AP is required for the induction of LTP and LTP-IE. A, Statistical data showing changes in synaptic EPSCs (top) and postsynaptic AP threshold (bottom) induced by CS (filled circle; n = 12 cells), synaptic stimulation alone (open square; n = 6 cells), post synaptic APs alone (open diamond; n = 5 cells), and time control (open circle; n = 13 cells). The amplitude of the EPSCs was normalized according to the amplitude of EPSCs during the control period, and the mean changes in the postsynaptic AP threshold (ΔThAP) were plotted against time. B, Left, The averaged amplitude of AHP before (Con) and after CS (**p < 0.01; paired t test; n = 10 cells) and in the time control group (T-Con; **p < 0.01; t test; n = 10 cells for each). Right, The firing frequency evoked by injecting a 60 pA current with 1 s duration. The firing frequency was significantly higher after CS (filled bar) than during control (open bar; p < 0.01; paired t test; n = 11). C, The somatic (open circle) and dendritic (filled circle) input resistance plotted against time. Dual recording with two pipettes in the soma and proximal dendrite was used. The somatic I-V curve was obtained by measuring somatic membrane potentials with dendritic current injection steps, and the dendritic I-V curve was obtained by measuring dendritic membrane potentials with somatic current injection steps. The slope input resistance was calculated from the linear region of the I-V curve. D, Recording traces of APs evoked by synaptic stimulation (arrows) during control conditions (Con) and after induction of LTP-IE (CS). Inset, Summary of changes in the threshold of synaptically evoked APs in the time control (open bar) and CS (filled bar) groups. **p < 0.01 compared with control; t test; n = 5 cells for each group.
Figure 3.
Figure 3.
Synaptic inputs and A-type K+ channels did not contribute to the CS-induced decrease in the AP threshold. A, Blockade of synaptic activities did not attenuate expression of LTP-IE. Cells were stimulated by CS first, and then the slice solution containing APV (50 μm), CNQX (20 μm), and Cd2+ (0.2 mm) was perfused (APV/CNQX/Cd). B, The mean AP threshold during control (Con), after CS, and after perfusion of APV/CNQX/Cd. The AP threshold in the presence of APV, CNQX, and Cd2+ (APV/CNQX/Cd) was not significantly different from that in the absence of blockers (CS; p = 0.31; paired t test; n = 5 cells). C, LTP-IE was induced by CS in the absence (CS) or presence of the GABAA and GABAB receptor antagonists bicuculline (30 μm) and CGP 55845A (3 μm) (CS/Bicu/CGP). The CS-induced decrease in the AP threshold in the presence of bicuculline and CGP 55845A (gray bar) was not significantly different from that in the absence of the blockers (filled bar; p = 0.77; paired t test; n = 5 cells). D, Induction of LTP-IE in the absence (open circle) and presence (filled circle) of intracellular 4-AP. E, Inhibition of A-type K+ channels by 4-AP (5 mm) did not induce changes in the AP threshold in the presence of the synaptic transmission blockers APV (50 μm), CNQX (20 μm), and Cd2+ (0.2 mm). F, The mean AP threshold during control (open bar) and application of 4-AP in the absence (4-AP alone) or presence of APV/CNQX/Cd, APV/CNQX, or APV/CNQX/bicuculline (APV/CNQX/Bicu). The AP threshold during perfusion of 4-AP was not significantly different from control in the presence of synaptic transmission blockers (p = 0.09, 0.10, and 0.71 for B, C, and D, respectively; paired t test; n = 5, 7, and 9 cells) but significantly decreased in the absence of the blockers (**p < 0.01; paired t test; n = 10 cells).
Figure 5.
Figure 5.
Changes in the inactivation curve of VGSCs during induction of LTP-IE. A, Voltage-dependent inactivation of VGSCs before (Con) and after CS tested by a prepulse protocol (bottom lines). The number at the left of each trace indicates the prepulse steps in millivolts. Prepulse steps from -104 to -44 mV in 10 mV steps (bottom lines) were given through cell-attached patch pipettes. Patches were held at -84 mV by adding +20 mV to the cell-attached patch pipette. The depolarization step after prepulses was -34 mV. Each trace was an ensemble average trace from six patches for each prepulse step. B, The inactivation curve of VGSCs before (open circle) and after (filled circle) CS. The inactivation curve was obtained by plotting normalized amplitude of ensemble trace (divided by the maximal amplitude) against prepulse steps. C, The mean amplitude of APs in the time control (open circle) and LTP-IE (filled circle) groups. The AP amplitude in the LTP-IE group was not significantly different from the time control before CS (p = 0.89; t test; n = 5 cells for each group) but significantly decreased 100 min after CS (p < 0.05; t test).
Figure 6.
Figure 6.
Activation of NMDARs and Ca2+ influx are required for induction of LTP-IE. A, EPSCs (top traces) and APs (bottom traces) from a representative cell showing that APV (50 μm) blocked both the increase in EPSCs and decrease in the postsynaptic AP threshold (arrow) induced by CS. B, Pooled data showing that, in the presence of APV, CS-induced changes in EPSCs (top) and in the postsynaptic AP threshold (bottom; open square; n = 5 cells) were not different from those in the time control group (open circle; n = 6 cells). Using dual whole-cell recording, BAPTA (10 mm) in the dendritic pipette blocked the CS-induced decrease in the AP threshold in somatic recording (bottom; open diamond; n = 6 cells). In the presence of MCPG (1 mm) and MSOP (100 μm), CS still induced LTP-IE (filled square). Inset, The mean amplitude of AHP during control (open bar) and after CS (filled bar) in the absence (1) or presence of APV (50 μm) (2) or MCPG (1 mm)/MSOP (100 μm) (3). In the presence of MCPG/MSOP, CS-induced reduction of AHP was significantly smaller than the absence the blockers (Fig. 2 B) (*p < 0.01; t test; n = 7) but still significantly different from control AHP (*p < 0.01; paired t test).
Figure 7.
Figure 7.
CS-induced Ca2+ signals in local dendrites. A, Images obtained with a two-photon microscopy showing Ca2+ signals in spines (1, 2), parent dendritic shafts of the spine (3), and dendritic branch points (4) during control (I), after synaptic stimulation (II), after APs (IV), and after CS (VI and VII). The left image is a Fluor-4 fluorescent signal showing Ca2+ levels, and the right image is an Alexa Fluor-594 fluorescent signal showing the morphology of dendrites and spines. Images were recorded at the time indicated in B. Scale bar, 2 μm. B, Ca2+ levels (ΔF/F) in response to synaptic stimulation (Syn-sti), postsynaptic APs, and CS from the dendritic structures (1-4) indicated in I. C, Averaged traces for Ca2+ levels induced by synaptic stimulation (black), APs (cyan), and CS (red) in spines (1 and 2; n = 7 cells), parent dendritic shafts of spines (3; n = 4 cells), and dendritic branch points (4; n = 4 cells).
Figure 8.
Figure 8.
Activity of CaMK II is required for the induction of LTP-IE. A, Representative recordings of EPSCs (top traces) and APs (bottom traces) during control and 100 min after CS in the presence of KN-62. B, Pooled data showing the CS-induced changes in EPSCs (top) and AP threshold (bottom) in the presence of KN-62 (open square; n = 6 cells) or AIP (open diamond; n = 5 cells) compared with data from time control cells (open circle). Inset, The mean AP amplitude in the presence of KN-62 (gray bar) or AIP (filled bar) compared with control cells (open bar) and the mean AHP amplitude (AHP) before (open bar) and after CS in the presence of KN-62 (gray bar) or AIP (filled bar). *p < 0.05; paired t test.
Figure 9.
Figure 9.
Function of protein synthesis is required for induction of LTP-IE. A, Representative recordings of EPSCs (top traces) and APs (bottom traces) during control and 30 and 100 min after CS in the presence of emetine (5 μm). B, Pooled data showing the CS-induced changes in EPSPs (top) and AP threshold (bottom) in the presence of emetine (open diamond; n = 5 cells) or anisomycin (5 μm; open square; n = 5 cells) compared with data from time control cells (open circle). Inset, The mean AP amplitude in the presence of emetine (gray bar) and anisomycin (filled bar) compared with control cells (open bar) and the mean AHP amplitude before (open bar) and after CS in the presence of emetine (gray bar) or anisomycin (filled bar). *p < 0.05; paired t test.

Similar articles

Cited by

References

    1. Abel T, Nguyen PV, Barad M, Deuel TA, Kandel ER, Bourtchouladze R (1997) Genetic demonstration of a role for PKA in the late phase of LTP and in hippocampus-based long-term memory. Cell 88: 615-626. - PubMed
    1. Abraham WC, Gustafsson B, Wigstrom H (1987) Long-term potentiation involves enhanced synaptic excitation relative to synaptic inhibition in guinea-pig hippocampus. J Physiol (Lond) 394: 367-380. - PMC - PubMed
    1. Aizenman CD, Linden DJ (2000) Rapid, synaptically driven increases in the intrinsic excitability of cerebellar deep nuclear neurons. Nat Neurosci 3: 109-111. - PubMed
    1. Aizenman CD, Akerman CJ, Jensen KR, Cline HT (2003) Visually driven regulation of intrinsic neuronal excitability improves stimulus detection in vivo. Neuron 39: 831-842. - PubMed
    1. Alkon DL, Sakakibara M, Forman R, Harrigan J, Lederhendler I, Farley J (1985) Reduction of two voltage-dependent K+ currents mediates retention of a learned association. Behav Neural Biol 44: 278-300. - PubMed

Publication types

MeSH terms

Substances