. 2005 Feb 16;25(7):1866-80.
doi: 10.1523/JNEUROSCI.3897-04.2005.

Role of synaptic and intrinsic membrane properties in short-term receptive field dynamics in cat area 17

Affiliations

Role of synaptic and intrinsic membrane properties in short-term receptive field dynamics in cat area 17

Lionel G Nowak et al. J Neurosci. .

Abstract

We examined the mechanisms through which the prolonged presentation of either a high-contrast stimulus or an artificial scotoma [equivalent to the stimulation of the receptive field (RF) surround] induces changes in the RF properties of neurons intracellularly recorded in cat primary visual cortex. Discharge and synaptic RFs were quantitatively characterized using bright and dark bars randomly flashed in various positions. Compared with the lack of stimulation (0% contrast for 15-30 s), stimulation with high-contrast sine-wave gratings (15-30 s) was followed by a strong reduction in gain and a weak but significant reduction in width of spike discharge RFs. These reductions were accompanied by a membrane potential hyperpolarization, a decrease of synaptic RF width, and varying changes of synaptic RF gain. Passive hyperpolarization by DC injection also produced significant reduction in the width and gain of discharge RF. Mimicking, in single neurons, high-contrast stimulation with high-intensity current injection also induced a membrane potential hyperpolarization, whose amplitude was correlated with discharge RF gain and width changes. Recovery from adaptation to high-contrast stimulation during the period of gray screen or scotoma presentation was associated with an increase in gain and discharge RF size. Stimulation of the RF surround with an artificial scotoma did not have any additional aftereffects over those of adaptation to a gray screen, indicating that the contraction and expansion of RF gain and size are attributable to intrinsic and synaptic mechanisms underlying adaptation and de-adaptation to strong visual stimuli.


Figures

Figure 1.
Figure 1.
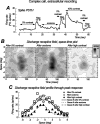
Effects of high-contrast and artificial scotoma on the discharge RF in a cortical simple cell. A, Mean firing rate (F0 component, in red) and the discharge that is modulated at the temporal frequency of the grating drift (F1 component, in black) during the presentation of a gray screen, scotoma (40% contrast, except for a 0% contrast square 6° on a side centered over the RF), and finally a whole-screen, 40% contrast grating. In between each of these stimuli, the RF was mapped for 5 s as indicated. The entire sequence was repeated in a loop 69 times for averaging. B, Discharge RF maps obtained after each of the three stimulus conditions in A. The x-axis is time, the y-axis is space, and the z-axis, color coded, represents the firing rate as a function of both space and time. Each map has been obtained after subtraction of the map obtained in response to dark bar stimuli to the map obtained in response to bright bar stimuli. Increase in red saturation represents increased response to the bright bar, and increase in blue saturation represents increased response to dark bar. Between ∼50 and ∼130 ms, the x-t map shows two well defined subfields, corresponding to the ON response to the bright and ON response to the dark stimuli (in red and blue, respectively). After ∼130 ms, the response polarity is reversed. This reversion occurs after the end of the stimulus and corresponds to the OFF response to the bright bars (in effect, a contrast decrement from the brightness of the bar to the gray screen, equivalent to a dark bar response, thus appearing in blue) and OFF response to the dark bars (contrast increment from the dark stimulus to the gray screen, equivalent to a bright bar response, thus appearing in red). C, RF profile at time of peak response and Gabor fits of the data obtained for the three stimulus conditions. The data points represent experimental measures, and the lines represent the best fit through these data. The fits reveal a significant decrease in gain after high-contrast stimulation, to a value representing 58% of the gain obtained after 0% contrast. Change in RF width (90%) was not significant. Scotoma presentation significantly reduced RF gain (84%) but did not have a significant effect on RF width (88%). This data were obtained from an extracellularly recorded simple cell.
Figure 2.
Figure 2.
Effects of high-contrast and artificial scotoma on the discharge RF in a cortical complex cell. A, Discharge rate as a function of time plotted for the mean firing rate (F0 component). The sequence of stimuli, repeated 62 times, is labeled above the time series and follows the same order as in Figure 1. Scotoma side, 6°. B, Discharge RF profiles as mapped with the dark bar stimuli: left, after 0% contrast; middle, after scotoma presentation; right, after high contrast. C, RF profiles (symbols) at peak response after the three stimulus conditions and corresponding Gaussian fits (lines). Comparison of parameters extracted from the fits indicates that high-contrast stimulation was followed by a significant reduction of both RF gain and width (to 61 and 59% of the gain and width values after 0% contrast stimulation, respectively). On the other hand, the scotoma presentation induced an increase in gain (to 129% of the value obtained after 0% contrast stimulation) but no significant change in RF width (103%). These data were obtained from an extracellularly recorded complex cell.
Figure 4.
Figure 4.
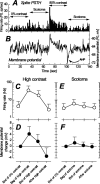
Average membrane potential of cortical neurons depends on temporal and spatial features of visual stimulation. A, PSTH of spike response (F0 component time series) for an intracellularly recorded complex cell in a four-stimulus protocol without RF mapping, as indicated. The scotoma was a 5° square, and the entire sequence was repeated four times for averaging. B, Membrane potential average (F0 component time series) during the stimulation protocol of A. C-F, Population summary (mean + SD) of the effects and aftereffects of high-contrast or scotoma stimulation on firing rate (C, E) and membrane potential (D, F). Each point represents the average of five F0 values, corresponding to either 0.8 or 1.6 s (depending on grating drift temporal frequency). The “After high contrast” point is the average of the first five points of either the 0% contrast or scotoma, depending on whichever followed the high-contrast stimulus. In some experiments in which mapping of the RF was performed (Figs. 1, 2, 9), the “After high contrast” values were determined from the second of gray screen that was inserted between the high-contrast stimulus and the mapping stimulus. In E and F, “After scotoma” corresponds to the value at the beginning of the gray screen presentation with some exceptions. (1) in some experiments in which mapping of the RF was performed (Figs. 1, 2), the “After scotoma” value was determined from the second of gray screen that was inserted between the scotoma and the mapping stimulus. (2) In some experiments, no gray screen was inserted between the end of the scotoma and the RF mapping. For these cells, the baseline corresponds to the mean values at the beginning of the mapping after 0% contrast, and the “After scotoma” value was determined from first values during the mapping after scotoma. Membrane potential changes in D and F are expressed relative to the membrane potential at the end of the 0% contrast stimulation. The spontaneous activity level is different in C and E because the cell samples are not the same.
Figure 8.
Figure 8.
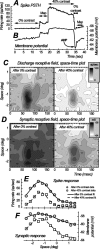
Aftereffects of high-contrast stimulation on the discharge and synaptic RFs in a simple cell. A, Spike response (F0 component, red; F1 component, black) as a function of time shows that the neuron was strongly activated by the high-contrast stimulus. B, Membrane potential time series (F0 and F1 components). Because stimuli sequences were given in a loop (17 repetitions), the 0% contrast period follows the map after the 40% contrast stimulation. The high-contrast stimulus induced a hyperpolarization of the membrane potential. This hyperpolarization (“AHP”) slowly deactivated during the 0% contrast period, leading to the slow depolarization of the neuron during adaptation to the gray screen. C, Discharge RF maps obtained before (left) and after (right) high-contrast adaptation (periods labeled “Map” in A). Maps obtained after subtraction of dark bar response from bright bar response. D, Synaptic RF maps. The membrane potential during mapping was hyperpolarized by 1.8 mV on average after high-contrast compared with after 0% contrast. E, Gabor fits through the spatial discharge RF map at the time of the peak response show strongly reduced gain (58%) but no significant width reduction (87%). F, Gabor fits through the peak synaptic response do not reveal a significant aftereffect of high-contrast adaptation on synaptic RF width (102%) or gain (108%).
Figure 9.
Figure 9.
Aftereffects of high-contrast stimulation on the discharge and synaptic RFs in a complex cell. A, B, Spike response (F0 component) and membrane potential (F0 component) as a function of time. In this case, a 1 s duration gray screen stimulus was inserted between the end of the high-contrast and the beginning of the second RF mapping. This allowed for the full expression of the post-adaptation hyperpolarization (“AHP”). Because stimuli sequences were given in a loop (21 repetitions), the hyperpolarization was still visible and slowly lessened during the 0% contrast period, leading to the slow depolarization of the neuron during adaptation to the gray screen. C, D, Discharge and synaptic RF maps obtained before (left) and after (right) high-contrast adaptation. x-t plots show dark bar response. The membrane potential during mapping was hyperpolarized by 2.9 mV on average after high-contrast compared with after 0% contrast. E, Gaussian fits through the peak response of the discharge RF map show significant reduction in both gain (65%) and width (69%). F, Gaussian fits through the peak response of the synaptic RF map show significantly increased gain (167%) and decreased width (69%) after high contrast.
Figure 11.
Figure 11.
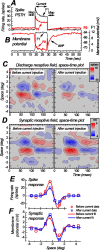
Aftereffects of action potential discharge induced by the intracellular injection of sinusoidal currents on discharge and synaptic RFs in a simple cell. The RF maps in C and D were obtained immediately before (maps on the left) or after (maps on the right) the injection, for 10 s, of a high-intensity (1.5 nA peak to peak) sinusoidal current in the recorded neuron (A, B). To allow for averaging, the current injection has been repeated 28 times. A, PSTH. B, Membrane potential average. Both F1 and F0 components are shown. The current injection led to a hyperpolarization of the membrane potential (“AHP”) that lasted for ∼15 s (time constant, 3.5 s). The mapping stimuli were active at all times, but the maps shown in C and D were calculated for 5 s before and 5 s after the current injection. E, RF profiles corresponding to the peak of the spike response in the x-t plots in C fitted with Gabor functions. No significant change in discharge RF width is evident (96.5%), but gain reduction (66.5%) during the afterhyperpolarization is clearly visible, indicating that activation of action potentials with current injection led to a decrease of response to the visual stimulation. F, The profiles and Gabor fits for the synaptic RFs indicate a significant gain increase (143%) after sinusoidal current injection and no significant change in synaptic RF width (87%).
Figure 3.
Figure 3.
Aftereffects of high-contrast and scotoma stimulation on discharge RFs. A, Histogram representing the gain after high-contrast stimulation as a percentage of the gain after adaptation to a gray screen (0% contrast stimulation). B, Histogram representing the RF width after high-contrast stimulation as a percentage of that after 0% contrast stimulation. C, Scatter plot presenting the relative gain and width after high-contrast stimulation. Most data points are in the bottom left quadrant, in the range of 0-100% for both axes. The two cells for which the gain was reduced to 0% are not represented because no RF width could be measured in these conditions. D, Gain after scotoma presentation as a percentage of gain after 0% contrast stimulation. E, RF width after scotoma presentation as a percentage of RF width after gray screen. F, Scatter plot of relative gain together with relative width after scotoma presentation versus gray screen. Compared with the scatter gram in C, the data appear well centered around the 100% axis, indicating no consistent differences on average between adaptation to a scotoma and adaptation to a gray screen in RF gain or width.
Figure 5.
Figure 5.
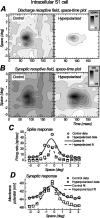
Effects of hyperpolarization of the membrane potential on the discharge and synaptic RF in a simple (S1) cell. A, Space versus time (x-t) plots of the discharge RF of a simple cell with a single subfield (activated by dark bars only). The RF map on the right (hyperpolarized) was obtained while the cell was hyperpolarized by 3 mV with the intracellular injection of current with respect to the map on the left. Note decreased spontaneous activity and decreased response strength. B, Space versus time plots of the synaptic RF obtained in the same conditions. C, Spatial RF profiles made for the time of the peak response in the discharge RF map. Gaussian curves have been fitted to the experimental data points. The gain (67% of control) and width (47%) of the discharge RF were significantly reduced when the cell was hyperpolarized. D, Spatial RF profiles made for the time of the peak response in the synaptic RF map. No significant change in width (92%) was observed, but the hyperpolarization induced an increase in gain (167%) in the synaptic RF.
Figure 6.
Figure 6.
Effects of hyperpolarization of the membrane potential on the discharge and synaptic RF in a simple cell. A, B, Space versus time plots of the discharge and synaptic RF. Maps obtained after subtraction of dark bars response from bright bars response. The maps on the right were obtained while the cell was hyperpolarized by 2.2 mV with DC compared with the maps on the left. C, Gabor fits of discharge RF profiles around peak response show weakly decreased gain (87%) and significantly reduced width (84%). D, Gabor fits of the synaptic RF profile do not show significant changes in gain (97%) or width (99.5%).
Figure 7.
Figure 7.
Hyperpolarization of the membrane potential with the intracellular injection of current results in a decrease in both response strength and discharge RF width. Plots of RF gain and width are of those in the hyperpolarized condition versus the control condition. A, Histogram summarizing increase in synaptic RF gain with membrane potential hyperpolarization. B, Histogram summarizing reduction in discharge RF gain with membrane potential hyperpolarization. C, Scatter plot of change in discharge RF gain versus changes in synaptic RF gain. The two variables are not significantly correlated. The scatter plot emphasizes the nearly systematic increase in synaptic RF gain and associated decrease in discharge RF gain. Dot size is proportional to membrane potential difference (-1.7 to -7.4 mV). There is no significant correlation between membrane potential hyperpolarization and synaptic or discharge RF gain changes. D, Synaptic RF width is not significantly affected by membrane potential hyperpolarization. E, Histogram summarizing reduction in discharge RF width with membrane potential hyperpolarization. F, Scatter plot of change in discharge RF gain versus changes in synaptic RF gain. The two variables are not significantly correlated. There was also no significant correlation between membrane potential hyperpolarization and synaptic or discharge RF width changes.
Figure 10.
Figure 10.
Impacts of membrane potential hyperpolarization and changes in synaptic RF on discharge RF gain and width after high-contrast adaptation. A, Histogram depicting the membrane potential hyperpolarization after high-contrast stimulation. The mean membrane potential during the mapping after high contrast has been subtracted from that during the mapping after 0% contrast stimulation. B, Histogram illustrating the gain of synaptic RF after high contrast, expressed as a percentage of the value obtained after 0% contrast stimulation. C, Relative gain of the discharge RF plotted against the change in membrane potential. D, Relative discharge RF gain plotted against relative synaptic RF gain. The simple cell that showed a synaptic RF gain down to 0 after high-contrast stimulation actually exhibited a significant discharge RF during this period. E, Membrane potential hyperpolarization after high-contrast stimulation (same as A). F, Relative synaptic RF width after high contrast. In contrast to synaptic RF gain, the synaptic RF width was significantly reduced after high contrast. G, Relative discharge RF width plotted against membrane potential change. H, Relative discharge RF width plotted against relative synaptic RF width. The decrease in synaptic RF width in simple cells was not systematically associated with a decrease in discharge RF width. To allow for a comparison with the aftereffects of sinusoidal current injection, the scales in A-H are the same as in Figure 12.
Figure 12.
Figure 12.
Consequences of high-intensity current injection on discharge and synaptic RF. A, Histogram showing that, at the population level, the membrane potential during the 5 s of mapping after intracellular sinusoidal current injection is more hyperpolarized than during the 5 s of mapping that precedes it. B, Synaptic RF gain after high-intensity current injection, expressed as a percentage of the value obtained before current injection. C, Relative discharge RF gain plotted against membrane potential change. There is a significant correlation between these two variables. D, Relative discharge RF gain plotted against percentage change in synaptic RF gain. E, Discharge RF gain, expressed as a percentage of the value obtained before current injection, is reduced, on average, after high-intensity current injection. F, Relative membrane potential after sinusoidal current injection replotted (same as A). G, Relative synaptic RF width after sinusoidal current injection, expressed as a percentage of the value obtained before current injection. H, Relative discharge RF width plotted against membrane potential change. There is a significant correlation between these two variables. I, Relative discharge RF width plotted against relative synaptic RF width. J, Discharge RF width, expressed as a percentage of the value obtained before current injection, was not significantly reduced in these protocols. To allow for a comparison with the aftereffects of high-contrast stimulation, the scales are the same as in Figure 10.

Similar articles

Cited by

References

    1. Ahmed B, Allison JD, Douglas RJ, Martin KA (1997) An intracellular study of the contrast-dependence of neuronal activity in cat visual cortex. Cereb Cortex 7: 559-570. - PubMed
    1. Albrecht DG, Farrar SB, Hamilton DB (1984) Spatial contrast adaptation characteristics of neurones recorded in cat's visual cortex. J Physiol (Lond) 347: 713-739. - PMC - PubMed
    1. Anderson JS, Lampl I, Gillepsie DC, Ferster D (2001) Membrane potential and conductance changes underlying length tuning of cells in cat primary visual cortex. J Neurosci 21: 2104-2112. - PMC - PubMed
    1. Angelucci A, Levitt JB, Walton EJ, Hupe JM, Bullier J, Lund JS (2002) Circuits for local and global signal integration in primary visual cortex. J Neurosci 22: 8633-8646. - PMC - PubMed
    1. Binzegger T, Douglas RJ, Martin KA (2004) A quantitative map of the circuit of cat primary visual cortex. J Neurosci 24: 8441-8453. - PMC - PubMed

Publication types

LinkOut - more resources