Comparative Study
. 2005 Mar;187(5):1581-90.
doi: 10.1128/JB.187.5.1581-1590.2005.

Experimental identification and quantification of glucose metabolism in seven bacterial species

Affiliations
Comparative Study

Experimental identification and quantification of glucose metabolism in seven bacterial species

Tobias Fuhrer et al. J Bacteriol. 2005 Mar.

Abstract

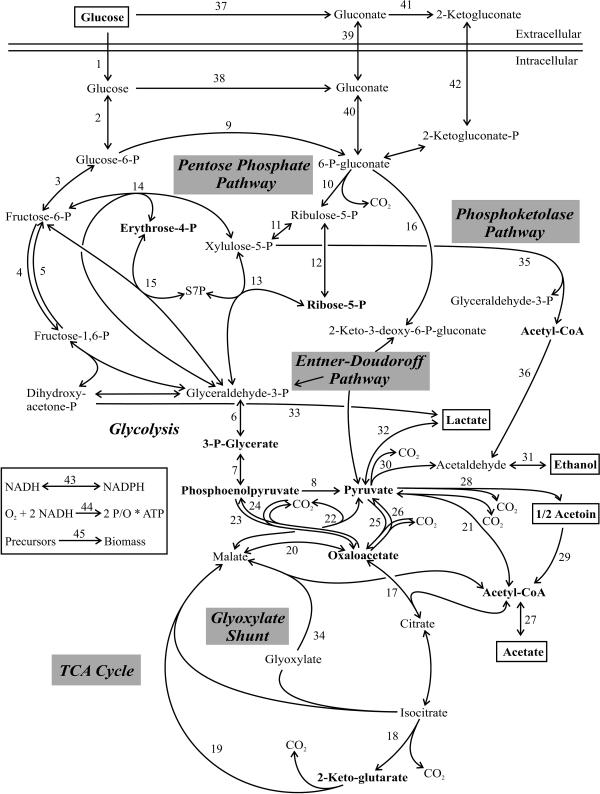
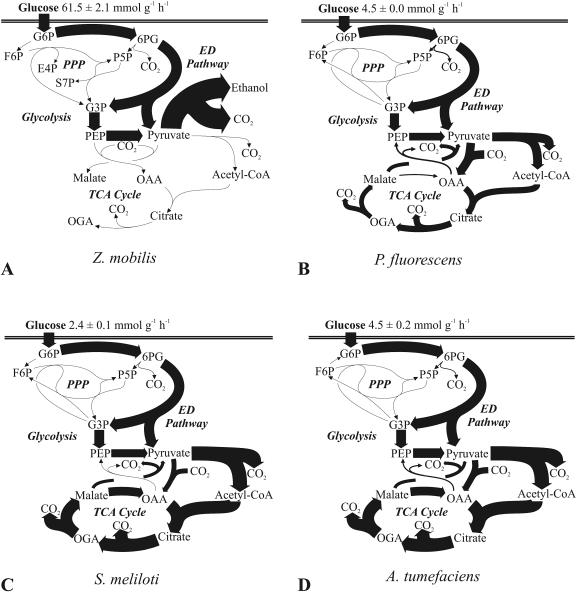
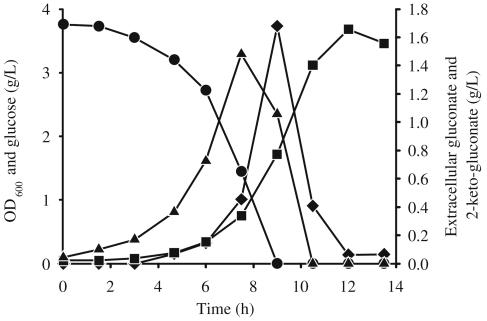
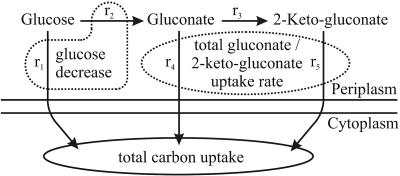
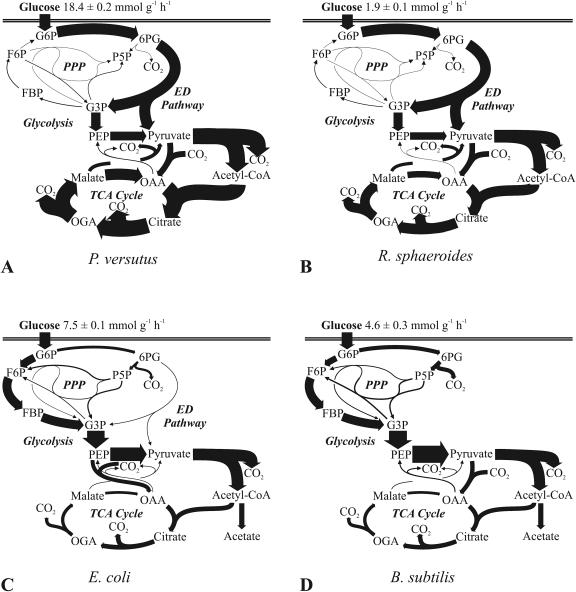
The structurally conserved and ubiquitous pathways of central carbon metabolism provide building blocks and cofactors for the biosynthesis of cellular macromolecules. The relative uses of pathways and reactions, however, vary widely among species and depend upon conditions, and some are not used at all. Here we identify the network topology of glucose metabolism and its in vivo operation by quantification of intracellular carbon fluxes from 13C tracer experiments. Specifically, we investigated Agrobacterium tumefaciens, two pseudomonads, Sinorhizobium meliloti, Rhodobacter sphaeroides, Zymomonas mobilis, and Paracoccus versutus, which grow on glucose as the sole carbon source, represent fundamentally different metabolic lifestyles (aerobic, anaerobic, photoheterotrophic, and chemoheterotrophic), and are phylogenetically distinct (firmicutes, gamma-proteobacteria, and alpha-proteobacteria). Compared to those of the model bacteria Escherichia coli and Bacillus subtilis, metabolisms of the investigated species differed significantly in several respects: (i) the Entner-Doudoroff pathway was the almost exclusive catabolic route; (ii) the pentose phosphate pathway exhibited exclusively biosynthetic functions, in many cases also requiring flux through the nonoxidative branch; (iii) all aerobes exhibited fully respiratory metabolism without significant overflow metabolism; and (iv) all aerobes used the pyruvate bypass of the malate dehydrogenase reaction to a significant extent. Exclusively, Pseudomonas fluorescens converted most glucose extracellularly to gluconate and 2-ketogluconate. Overall, the results suggest that metabolic data from model species with extensive industrial and laboratory history are not representative of microbial metabolism, at least not quantitatively.


Figures

FIG. 1.
FIG. 1.
Master reaction network that was used as the basis for net-flux analysis. Metabolites in bold were precursors for amino acid biosynthesis, and metabolites in boxes were extracellular substrates or products. Doubled-headed arrows indicate reactions assumed to be reversible. Abbreviations: S7P, sedoheptulose-7-P; Acetyl-CoA, acetyl coenzyme A.
FIG. 2.
FIG. 2.
In vivo carbon flux distribution in Z. mobilis (A), P. fluorescens (B), S. meliloti (C), and A. tumefaciens (D). All fluxes were normalized to the glucose uptake rate that is given at the top of each panel, and the widths of the arrows are scaled to the relative percentages of flux. Fluxes below 2.6% of the glucose uptake rate are represented by nonscaled hairlines. Possible cyclic fluxes through the ED pathways of P. fluorescens and S. meliloti are not resolved by the data and are not shown. Generally, the 95% confidence intervals were between 5 and 10% for the major fluxes. Larger confidence intervals were estimated for reactions with low flux. Abbreviations: G6P, glucose-6-P; 6PG, 6-P-gluconate; F6P, fructose-6-P; P5P, pentose-5-P; E4P, erythrose-4-P; S7P, sedoheptulose-7-P; G3P, glyceraldehyde-3-P; OGA, 2-ketoglutarate; PPP, PP pathway; Acetyl-CoA, acetyl coenzyme A.
FIG. 3.
FIG. 3.
Possible reactions that introduce C1 fragments into serine, methionine, and histidine (31). Abbreviations: AICAR-P, 5-aminoimidazole-4-carboxamide-1-ribotide; THFPG, tetrahydrofolylpolyglutamate; 10-Fo-THF, 10-formyl-tetrahydrofolyl; 5,10-Me-THF, 5,10-methyl-tetrahydrofolyl; 3PG, 3-P-glycerate; AcCoA, acetyl coenzyme A.
FIG. 4.
FIG. 4.
Time courses of OD600 (squares) and concentrations of extracellular glucose (circles), gluconate (triangles), and 2-ketogluconate (diamonds) in P. fluorescens.
FIG. 5.
FIG. 5.
Glucose uptake in P. fluorescens. The following fluxes (shown by arrows) are involved in glucose uptake: direct glucose uptake (r1), membrane-bound glucose dehydrogenase (r2), gluconate dehydrogenase (r3), uptake of gluconate (r4), and 2-ketogluconate (r5). The experimentally determined extracellular glucose decrease rate, a, is defined as r1 plus r2; the total carbon uptake rate by the cell, b, is defined as r1 plus r4 plus r5; and the total gluconate-2-ketogluconate uptake rate, g, is defined as r4 plus r5.
FIG. 6.
FIG. 6.
In vivo carbon flux distribution in Paracoccus versutus (A), R. sphaeroides (B), E. coli (C), and B. subtilis (D). All fluxes were normalized to the glucose uptake rates that are given at the top of each panel, and the widths of the arrows are scaled to the relative fluxes, expressed as percentages of the glucose uptake rates. Fluxes below 2.6% are represented by nonscaled hairlines. Generally, the 95% confidence intervals were between 5 and 10% for the major fluxes. Larger confidence intervals were estimated for reactions with low flux. Abbreviations: G6P, glucose-6-P; 6PG, 6-P-gluconate; F6P, fructose-6-P; FBP, fructose-1,6-bisphosphate; P5P, pentose-5-P; G3P, glyceraldehyde-3-P; OGA, 2-ketoglutarate; PPP, PP pathway; Acetyl-CoA, acetyl coenzyme A.

References

    1. Arthur, L. O., L. A. Bulla, Jr., G. St. Julian, and L. K. Nakamura. 1973. Carbohydrate metabolism in Agrobacterium tumefaciens. J. Bacteriol. 116:304-313. - PMC - PubMed
    1. Baker, S. C., S. J. Ferguson, B. Ludwig, M. D. Page, O.-M. Richter, and R. J. M. van Spanning. 1998. Molecular genetics of the genus Paracoccus: metabolically versatile bacteria with bioenergetic flexibility. Microbiol. Mol. Biol. Rev. 62:1046-1078. - PMC - PubMed
    1. Blank, L. M., and U. Sauer. 2004. TCA cycle activity in Saccharomyces cerevisiae is a function of the environmentally determined specific growth and glucose uptake rates. Microbiology 150:1085-1093. - PubMed
    1. Conrad, R., and H. G. Schlegel. 1977. Different degradation pathways for glucose and fructose in Rhodopseudomonas capsulata. Arch. Microbiol. 112:39-48. - PubMed
    1. Conrad, R., and H. G. Schlegel. 1977. Influence of aerobic and phototrophic growth conditions on the distribution of glucose and fructose carbon into the Entner-Doudoroff and Embden-Meyerhof pathways in Rhodopseudomonas sphaeroides. J. Gen. Microbiol. 101:277-290.

Publication types