Cytosolic Ca2+ concentration and rate of increase of the cytosolic Ca2+ concentration in the regulation of vascular permeability in Rana in vivo
- PMID: 15718259
- PMCID: PMC1464473
- DOI: 10.1113/jphysiol.2005.083220
Cytosolic Ca2+ concentration and rate of increase of the cytosolic Ca2+ concentration in the regulation of vascular permeability in Rana in vivo
Abstract
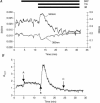
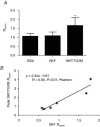
Vascular permeability is assumed to be regulated by the cytosolic Ca(2+) concentration ([Ca(2+)](c)) of the endothelial cells. When permeability is increased, however, the maximum [Ca(2+)](c) appears to occur after the maximum permeability increase, suggesting that Ca(2+)-dependent mechanisms other than the absolute Ca(2+) concentration may regulate permeability. Here we investigate whether the rate of increase of the [Ca(2+)](c) (d[Ca(2+)](c)/dt) may more closely approximate the time course of the permeability increase. Hydraulic conductivity (L(p)) and endothelial [Ca(2+)](c) were measured in single perfused frog mesenteric microvessels in vivo. The relationships between the time courses of the increased L(p), [Ca(2+)](c) and d[Ca(2+)](c)/dt were examined. L(p) peaked significantly earlier than [Ca(2+)](c) in all drug treatments examined (Ca(2+) store release, store-mediated Ca(2+) influx, and store-independent Ca(2+) influx). When L(p) was increased in a store-dependent manner the time taken for L(p) to peak (3.6 +/- 0.9 min during store release, 1.2 +/- 0.3 min during store-mediated Ca(2+) influx) was significantly less than the time taken for [Ca(2+)](c) to peak (9.2 +/- 2.8 min during store release, 2.1 +/- 0.7 min during store-mediated influx), but very similar to that for the peak d[Ca(2+)](c)/dt to occur (4.3 +/- 2.0 min during store release, 1.1 +/- 0.5 min during Ca(2+) influx). Additionally, when the increase was independent of intracellular Ca(2+) stores, L(p) (0.38 +/- 0.03 min) and d[Ca(2+)](c)/dt (0.30 +/- 0.1 min) both peaked significantly before the [Ca(2+)](c) (1.05 +/- 0.31 min). These data suggest that the regulation of vascular permeability by endothelial cell Ca(2+) may be regulated by the rate of change of the [Ca(2+)](c) rather than the global [Ca(2+)].
Figures


Similar articles
-
Role of endothelial Ca2+ stores in the regulation of hydraulic conductivity of Rana microvessels in vivo.Am J Physiol Heart Circ Physiol. 2003 Apr;284(4):H1468-78. doi: 10.1152/ajpheart.00585.2002. Epub 2003 Jan 2. Am J Physiol Heart Circ Physiol. 2003. PMID: 12511429
-
The role of endothelial cell Ca2+ store release in the regulation of microvascular permeability in vivo.Exp Physiol. 2004 Jul;89(4):343-51. doi: 10.1113/expphysiol.2003.026948. Epub 2004 Mar 16. Exp Physiol. 2004. PMID: 15123553
-
VEGF and ATP act by different mechanisms to increase microvascular permeability and endothelial [Ca(2+)](i).Am J Physiol Heart Circ Physiol. 2000 Oct;279(4):H1625-34. doi: 10.1152/ajpheart.2000.279.4.H1625. Am J Physiol Heart Circ Physiol. 2000. PMID: 11009449
-
Ca2+ signaling, TRP channels, and endothelial permeability.Microcirculation. 2006 Dec;13(8):693-708. doi: 10.1080/10739680600930347. Microcirculation. 2006. PMID: 17085428 Review.
-
Modulation of venular microvessel permeability by calcium influx into endothelial cells.FASEB J. 1992 Apr;6(7):2456-66. doi: 10.1096/fasebj.6.7.1563597. FASEB J. 1992. PMID: 1563597 Review.
Cited by
-
Contribution of elevated intracellular calcium to pulmonary arterial myocyte alkalinization during chronic hypoxia.Pulm Circ. 2016 Mar;6(1):93-102. doi: 10.1086/685053. Pulm Circ. 2016. PMID: 27076907 Free PMC article.
-
Endothelial Protrusions in Junctional Integrity and Barrier Function.Curr Top Membr. 2018;82:93-140. doi: 10.1016/bs.ctm.2018.08.006. Epub 2018 Sep 27. Curr Top Membr. 2018. PMID: 30360784 Free PMC article.
-
Vascular endothelial growth factor-C, a potential paracrine regulator of glomerular permeability, increases glomerular endothelial cell monolayer integrity and intracellular calcium.Am J Pathol. 2008 Oct;173(4):938-48. doi: 10.2353/ajpath.2008.070416. Epub 2008 Sep 4. Am J Pathol. 2008. PMID: 18772335 Free PMC article.
-
Functional role of TRPC channels in the regulation of endothelial permeability.Pflugers Arch. 2005 Oct;451(1):131-42. doi: 10.1007/s00424-005-1461-z. Epub 2005 Jun 30. Pflugers Arch. 2005. PMID: 15988589 Review.
-
The anti-angiogenic VEGF isoform VEGF165b transiently increases hydraulic conductivity, probably through VEGF receptor 1 in vivo.J Physiol. 2006 Apr 1;572(Pt 1):243-57. doi: 10.1113/jphysiol.2005.103127. Epub 2006 Jan 19. J Physiol. 2006. PMID: 16423853 Free PMC article.
References
-
- Adamson RH, Zeng M, Adamson GN, Lenz JF, Curry FE. PAF-and bradykinin-induced hyperpermeability of rat venules is independent of actin-myosin contraction. Am J Physiol Heart Circ Physiol. 2003;285:H406–H417. - PubMed
-
- Bates DO, Curry FE. Vascular endothelial growth factor increases hydraulic conductivity of isolated perfused microvessels. Am J Physiol Heart Circ Physiol. 1996;271:H2520–H2528. - PubMed
-
- Bates DO, Curry FE. Vascular endothelial growth factor increases microvascular permeability via a Ca2+-dependent pathway. Am J Physiol Heart Circ Physiol. 1997;273:H687–H694. - PubMed
-
- Curry FE. Modulation of venular microvessel permeability by calcium influx into endothelial cells. Faseb J. 1992;6:2456–2466. - PubMed
Publication types
MeSH terms
Substances
LinkOut - more resources
Full Text Sources
Miscellaneous

