. 2005 Mar 9;24(5):963-73.
doi: 10.1038/sj.emboj.7600588. Epub 2005 Feb 17.

Expression of AMAP1, an ArfGAP, provides novel targets to inhibit breast cancer invasive activities

Affiliations

Expression of AMAP1, an ArfGAP, provides novel targets to inhibit breast cancer invasive activities

Yasuhito Onodera et al. EMBO J. .

Abstract

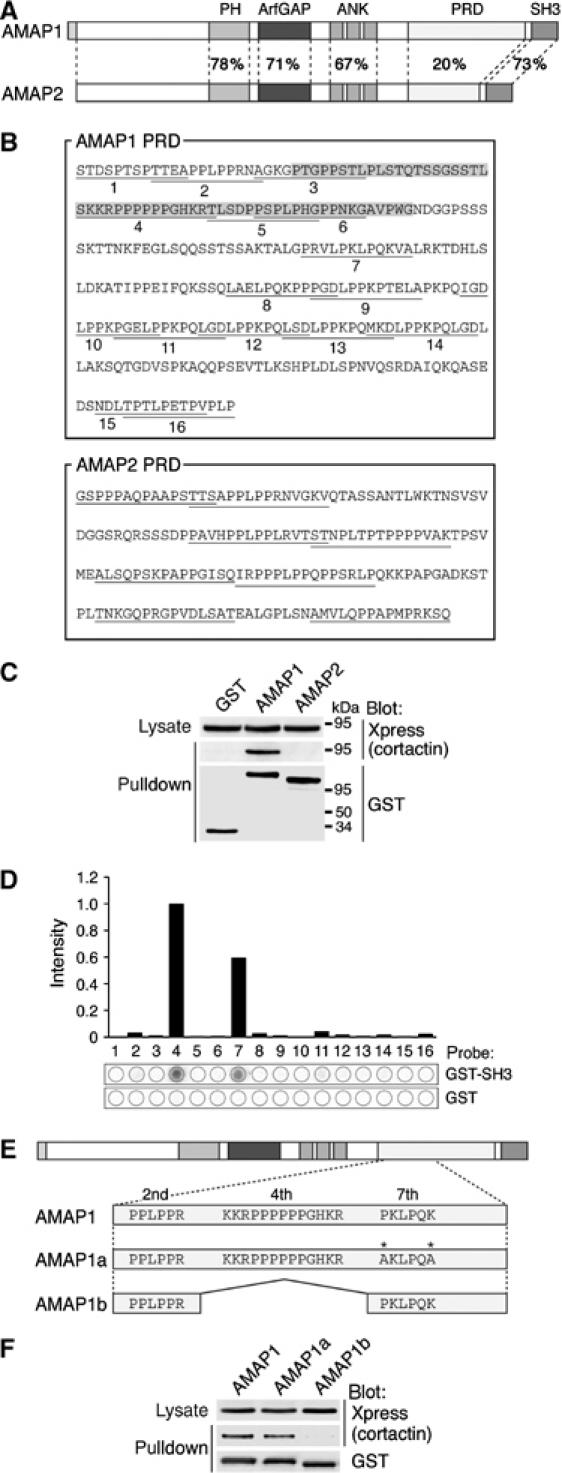
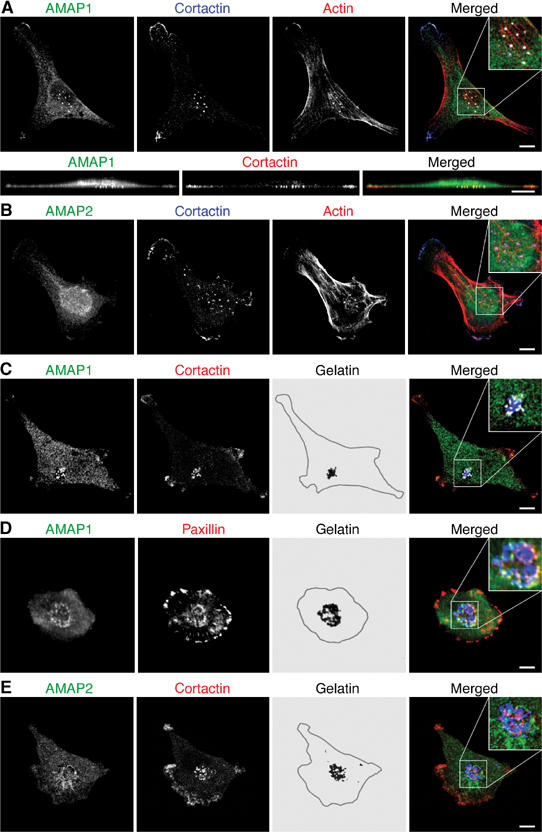
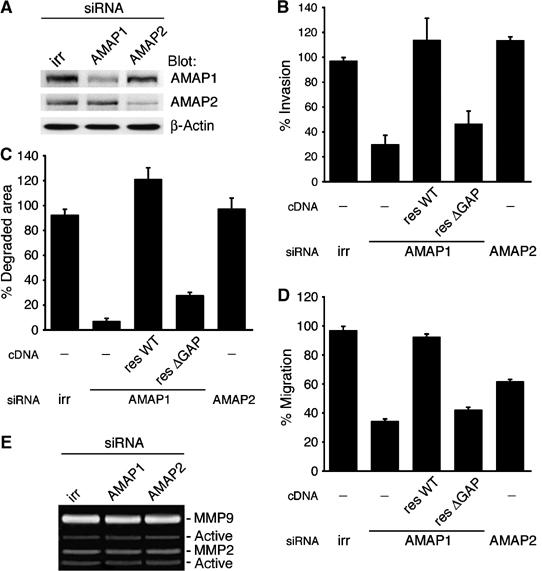
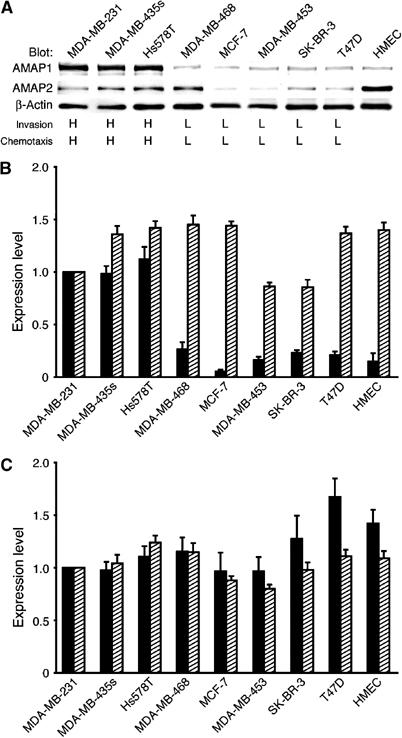
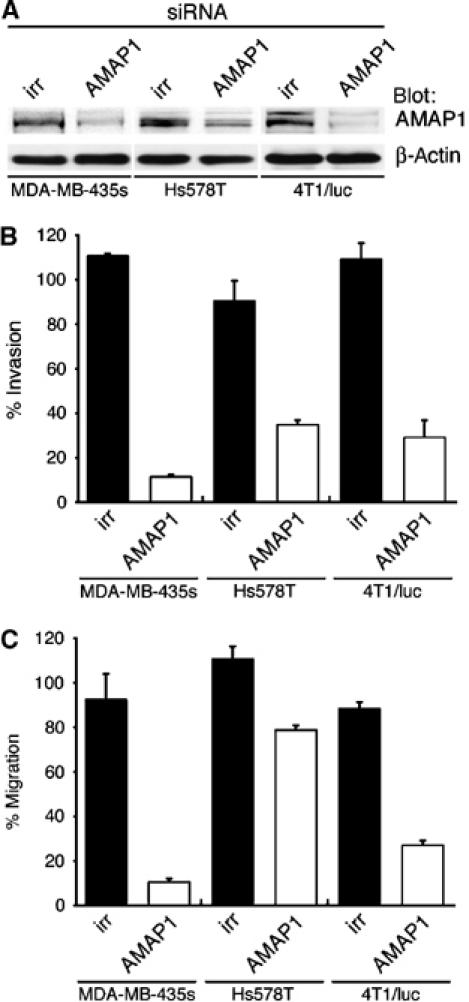
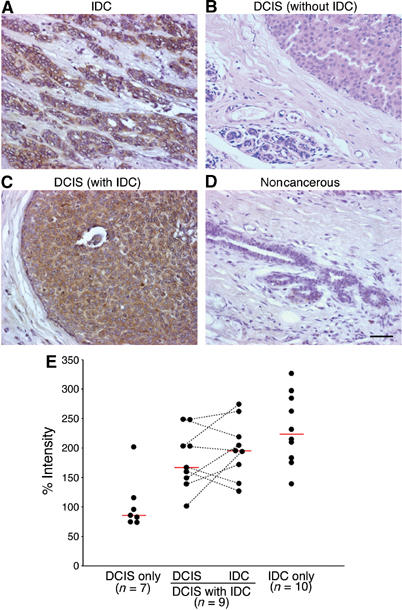
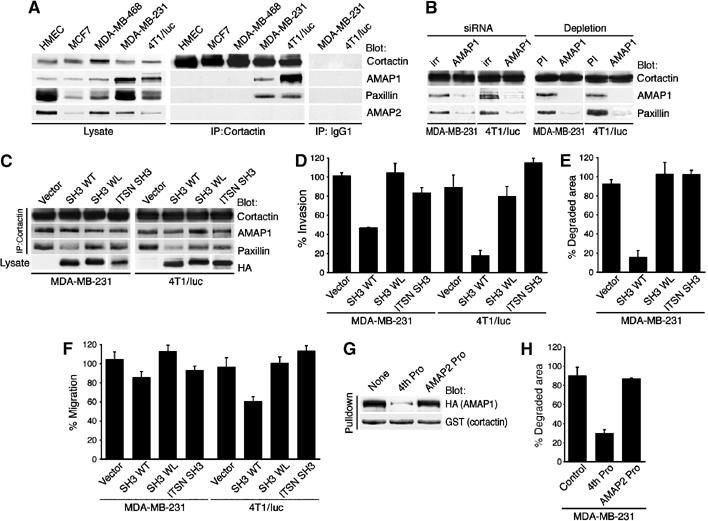
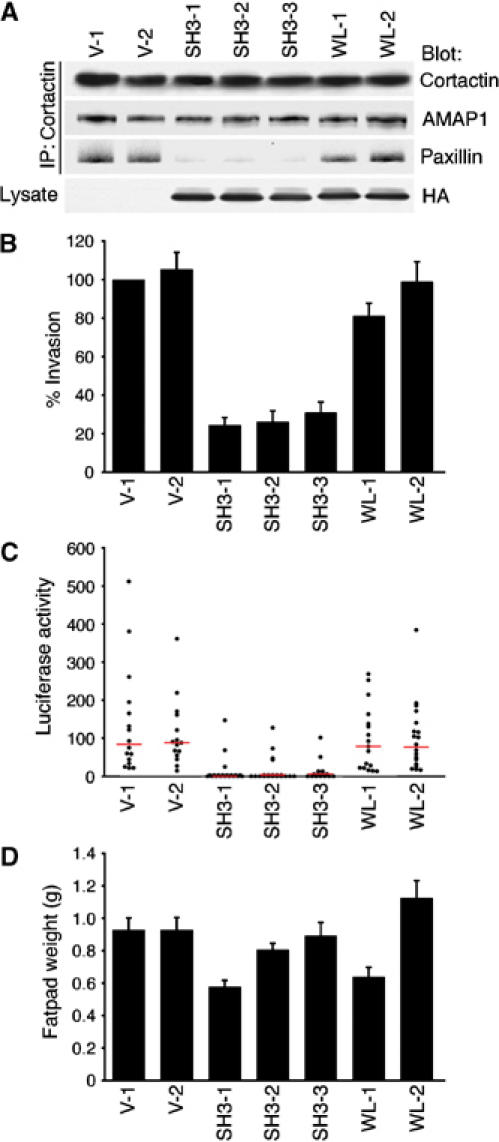
Identification of the molecular machinery employed in cancer invasion, but not in normal adult cells, will greatly contribute to cancer therapeutics. Here we found that an ArfGAP, AMAP1/PAG2, is expressed at high levels in highly invasive breast cancer cells, but at very low levels in noninvasive breast cancer cells and normal mammary epithelial cells. siRNA-mediated silencing of AMAP1 effectively blocked the invasive activities. AMAP1 expression in human breast primary tumors also indicated its potential correlation with malignancy. Paxillin and cortactin have been shown to colocalize at invadopodia and play a pivotal role in breast cancer invasion. We found that AMAP1 is also localized at invadopodia, and acts to bridge paxillin and cortactin. This AMAP1-mediated trimeric protein complex was detected only in invasive cancer cells, and blocking this complex formation effectively inhibited their invasive activities in vitro and metastasis in mice. Our results indicate that AMAP1 is a component involved in invasive activities of different breast cancers, and provide new information regarding the possible therapeutic targets for prevention of breast cancer invasion and metastasis.


Figures

Figure 1
Figure 1
Binding of AMAP1 to cortactin. (A) Schematic representation of AMAP1 and AMAP2. Amino-acid sequence homology between each domain is indicated by percentages. (B) Amino-acid sequences of PRDs of AMAP1 and AMAP2. Each proline-rich sequence of the AMAP1 PRD is underlined and numbered (1st–16th). The shaded box indicates the alternate exon, which AMAP1b lacks. (C) In vivo binding of AMAP1 and cortactin. Xpress-cortactin was coexpressed with GST-AMAP1, GST-AMAP2 or GST alone in COS-7 cells, and GST proteins were pulled down using glutathione beads. After separation by SDS–PAGE, the precipitates were subjected to immunoblotting analysis, as indicated. (D) Biochemical identification of the AMAP1 proline-rich sequence(s) responsible for binding to the cortactin SH3 domain. Each proline-rich sequence of the AMAP1 PRD was synthesized on membranes, and probed with radiolabeled GST-cortactin SH3 or GST alone. Spots 1–16 correspond to the 1st–16th proline-rich sequences, respectively. Radioactivities retained on each spot were expressed as a value with spot 4 normalized as 1.0 (upper panel). (E) Schematic representation of a spliced isoform and a mutant of AMAP1. (F) Requirement of the fourth proline-rich sequence of AMAP1 for its binding to cortactin. Xpress-cortactin, coexpressed with GST-AMAP1, GST-AMAP1a or GST-AMAP1b in COS-7 cells, was pulled down and subjected to immunoblotting analysis, as above.
Figure 2
Figure 2
Localization of AMAP1 at invadopodia of MDA-MB-231 cells. Confocal projections of cells stained with anti-AMAP1 (A, C, D), anti-AMAP2 (B, E), anti-cortactin (A–C, E), anti-paxillin (D) and phalloidin (A, B). In (A), z-sections of the images are shown in the lower panels. Cells were cultured for 16 h on a crosslinked gelatin matrix (A, B) or a fluorescently labeled, crosslinked gelatin matrix, in which degraded gelatin zones are shown in black (C–E). In (A–E), representative images are shown from more than 50 cells analyzed. In the merged images, each protein is shown in the color as labeled in the left panels. Degraded gelatin zones in the merged images of (C–E) are indicated in blue. Bars, 10 μm.
Figure 3
Figure 3
Silencing AMAP1 expression blocks the in vitro invasive activities of MDA-MB-231 cells. Cells were treated with siRNA duplexes against AMAP1or AMAP2, or with an irrelevant sequence (irr). (A) siRNA-mediated knockdown of AMAP1 and AMAP2 protein expression. Lysates prepared from siRNA-treated cells were analyzed by immunoblotting using antibodies as indicated. (B–D) Effects of siRNA-mediated knockdown of AMAP1 and AMAP2 on cellular activities. The percentages of siRNA-treated cells that transmigrated through a barrier of Matrigel toward chemoattractants (Matrigel chemoinvasion assay (B)), total area of gelatin degradation (C) and cells that transmigrated toward collagen in a modified Boyden chamber (haptotactic migration assay (D)) are shown. Data collection and presentation are described in Materials and methods. Results shown are the means±s.e.m. of three experiments. (E) Secretion of MMP2 and MMP9 was assayed in siRNA-treated cells using the gelatin zymography method.
Figure 4
Figure 4
Protein and mRNA expression of AMAP1 in different breast cancer cell lines. (A) Cell lysates were subjected to immunoblotting analysis using antibodies against AMAP1, AMAP2 and β-actin. Invasive activities from the literature (Thompson et al, 1992; Bowden et al, 1999; Zajchowski et al, 2001) are shown in the bottom rows, graded as % MDA-MB-231 cells: L, 0–40%; M, 40–60%; H, >60%. (B, C) Amounts of mRNAs for AMAP1 (B) and β-actin (C), quantified by a real-time PCR amplification method (hatched bars), and their protein levels (closed bars), measured by densitometric scanning of the immunoblots, are shown. Results shown are the means±s.e.m. of three experiments, by normalizing the values obtained for MDA-MB-231 cells as 1.0.
Figure 5
Figure 5
Silencing of AMAP1 expression blocks the in vitro invasive activities of different breast cancer cell lines. Effects of AMAP1 siRNA treatment on AMAP1 protein expression (A), Matrigel chemoinvasion activity (B) and haptotactic migration toward collagen (C) are measured as in Figure 3, with the indicated cancer cell lines. irr, siRNA duplex with an irrelevant sequence. Results shown are the means±s.e.m. of three experiments.
Figure 6
Figure 6
Immunohistochemical staining of AMAP1 in primary tumors of the human breast. Tissue sections were immunostained with an affinity-purified anti-AMAP1 polyclonal antibody. Positive staining for the AMAP1 protein is shown in a reddish-brown color. (A) Breast carcinoma diagnosed as IDC. (B) Breast carcinoma diagnosed as DCIS without the co-occurrence of IDC. (C) Site of a breast carcinoma diagnosed as DCIS, in which the patient simultaneously has IDC. (D) Noncancerous breast components from the same patient as (A). Bar, 50 μm in (A–D). (E) Relative levels of AMAP1 staining in primary tumors plotted into four groups by their tumor types. The percentage staining intensity of cancerous cells relative to the staining of noncancerous cells on the same slides set as 100% is shown. In samples of DCIS+IDC, values from the same patient were connected with dotted lines. Median values were calculated and are presented as red lines.
Figure 7
Figure 7
Roles of the AMAP1-mediated protein complex formation with paxillin and cortactin in in vitro invasion activities of MDA-MB-231 and 4T1/luc cells. (A) Assessment of AMAP1-mediated trimeric protein complex formation in breast cancer cell lines and normal mammary epithelial cells (HMEC). Anti-cortactin immunoprecipitates (middle panel) or control nonimmune mouse IgG1 precipitants (right panel) were analyzed for co-precipitation of AMAP1, AMAP2 and paxillin by immunoblotting using antibodies as indicated (middle panel). Protein levels in total cell lysates are shown in the left panel. (B) Requirement of AMAP1 for the co-precipitation of paxillin and cortactin. AMAP1 was knocked down by its siRNA (left panel) or predepleted from the lysates using anti-AMAP1 antibodies (right panel). irr, siRNA with an irrelevant sequence; PI, control preimmune rabbit IgG. Lysates were then analyzed as above. (C–F) Effects of overexpression of the AMAP1 SH3 domain on AMAP1-mediated trimeric protein complex formation (C), Matrigel chemoinvasion activity (D), total area of gelatin degradation (E) and haptotactic migration activity toward collagen (F). MDA-MB-231 cells and 4T1/luc cells were transfected with pcDNA3HA/AMAP1SH3 encoding the wild-type AMAP1 SH3 domain (SH3 WT), pcDNA3HA/AMAP1SH3WL encoding its WL mutant (SH3 WL), pcDNA3HA/ITSN SH3 encoding the intersectin SH3 domains (ITSN SH3) or the empty vector (vector). Overexpression of the AMAP1 SH3 domain reduced the amount of paxillin co-precipitated with anti-cortactin by 68.6±6.2% in MDA-MB-231 cells and by 77.5±2.8% in 4T1/luc cells as compared to that in vector control cells, calculated from three independent experiments. (G, H) Effects of the fourth proline-rich peptide of the AMAP1 PRD. GST-cortactin purified on glutathione beads was incubated with COS-7 cell lysates expressing HA-AMAP1 in the absence (none) or presence of the fourth proline-rich peptide (4th pro) or the control AMAP2 proline-rich peptide (AMAP2 pro), and the amount of HA-AMAP1 co-precipitated with GST-cortactin was analyzed by anti-HA immunoblotting (G). MDA-MB-231 cells microinjected with these peptides were analyzed for the total area of degradation (H). In (D–F, H), results shown are the means±s.e.m. of three independent experiments.
Figure 8
Figure 8
Effect of the inhibition of AMAP1-mediated protein complex formation on metastasis in vivo. 4T1/luc cell clones, stably overexpressing the HA-tagged AMAP1 SH3 domain (SH3-1, SH3-2 and SH3-3) or its WL mutant (WL-1 and WL-2), or stably transfected with the empty vector (V-1 and V-2), were established. (A) Levels of the AMAP1 SH3 domain or the WL mutant in each cell clone (upper panel), and co-precipitation of paxillin with AMAP1 in these cell clones (lower panel) were examined, as described in Figure 7B by anti-HA immunoblotting. (B) In vitro Matrigel invasion activity of cell clones. (C, D) Tumor metastasis in the left lung via injection of these clones into the right inguinal mammary fat pad of Balb/c mice. The luciferase activity in the left lungs isolated from these mice 19 days after the injection was measured, and plotted as activity per mg of the total protein after subtracting the background values. Median values were calculated and are presented as red lines (C). The weight of the tumors at sites of the originally injected mammary fat pad was measured simultaneously and is also plotted (D). A total of 20 mice were used for each cell clone. In (B, D), results shown are the means±s.e.m.

References

    1. Allred DC, Mohsin SK, Fuqua SA (2001) Histological and biological evolution of human premalignant breast disease. Endocr Relat Cancer 8: 47–61 - PubMed
    1. Andreev J, Simon JP, Sabatini DD, Kam J, Plowman G, Randazzo PA, Schlessinger J (1999) Identification of a new Pyk2 target protein with Arf-GAP activity. Mol Cell Biol 19: 2338–2350 - PMC - PubMed
    1. Bowden ET, Barth M, Thomas D, Glazer RI, Mueller SC (1999) An invasion-related complex of cortactin, paxillin and PKCmu associates with invadopodia at sites of extracellular matrix degradation. Oncogene 18: 4440–4449 - PubMed
    1. Bowden ET, Coopman PJ, Mueller SC (2001) Invadopodia: unique methods for measurement of extracellular matrix degradation in vitro. Methods Cell Biol 63: 613–627 - PubMed
    1. Brown MT, Andrade J, Radhakrishna H, Donaldson JG, Cooper JA, Randazzo PA (1998) ASAP1, a phospholipid-dependent arf GTPase-activating protein that associates with and is phosphorylated by Src. Mol Cell Biol 18: 7038–7051 - PMC - PubMed

Publication types

MeSH terms