. 2005 Feb;3(2):e37.
doi: 10.1371/journal.pbio.0030037. Epub 2005 Feb 8.

Parsing a cognitive task: a characterization of the mind's bottleneck

Affiliations

Parsing a cognitive task: a characterization of the mind's bottleneck

Mariano Sigman et al. PLoS Biol. 2005 Feb.

Abstract

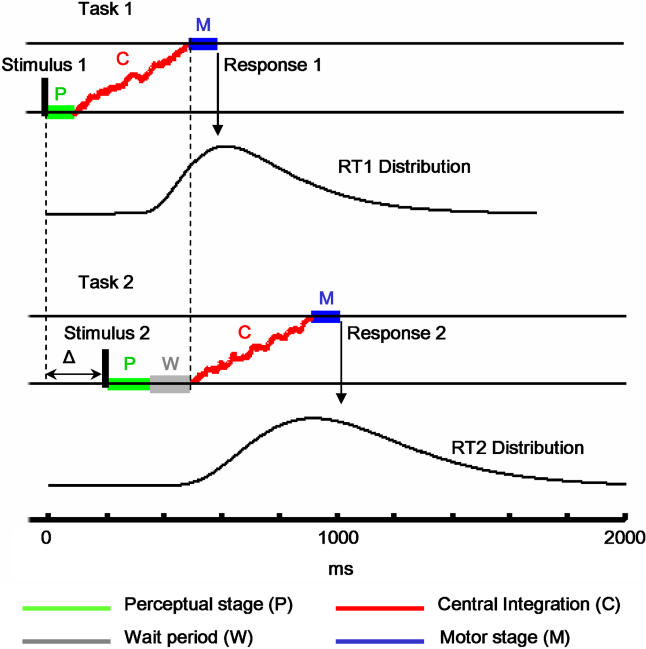
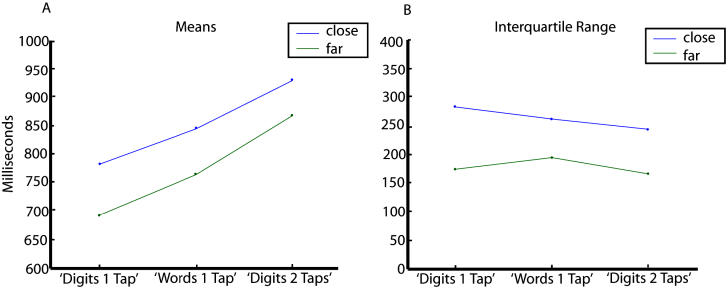
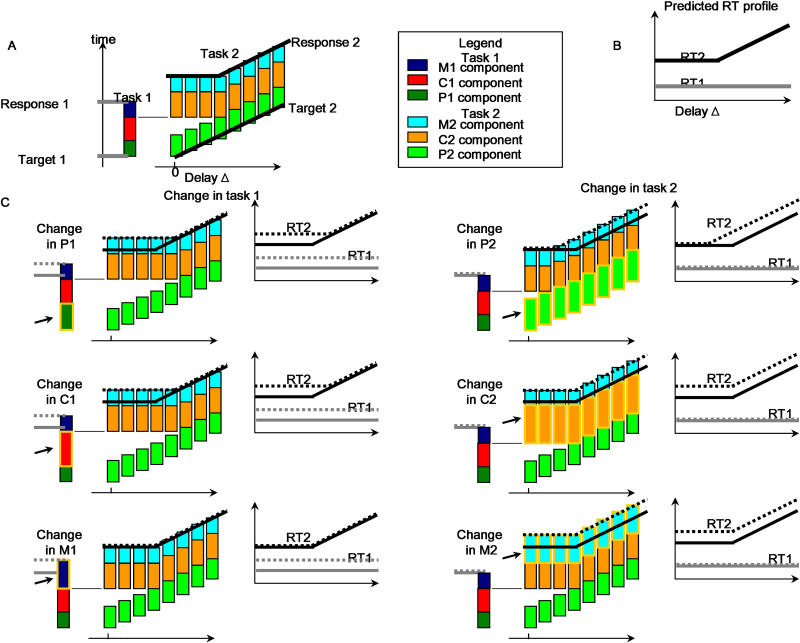
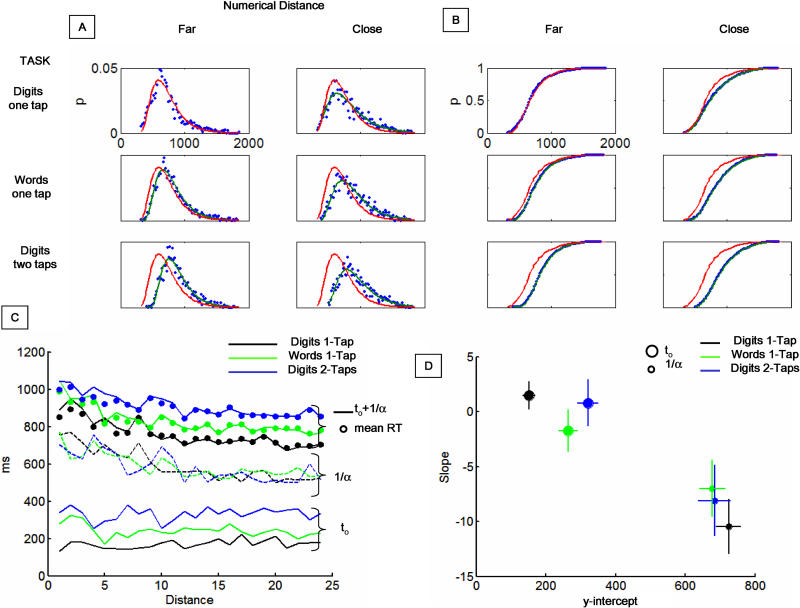
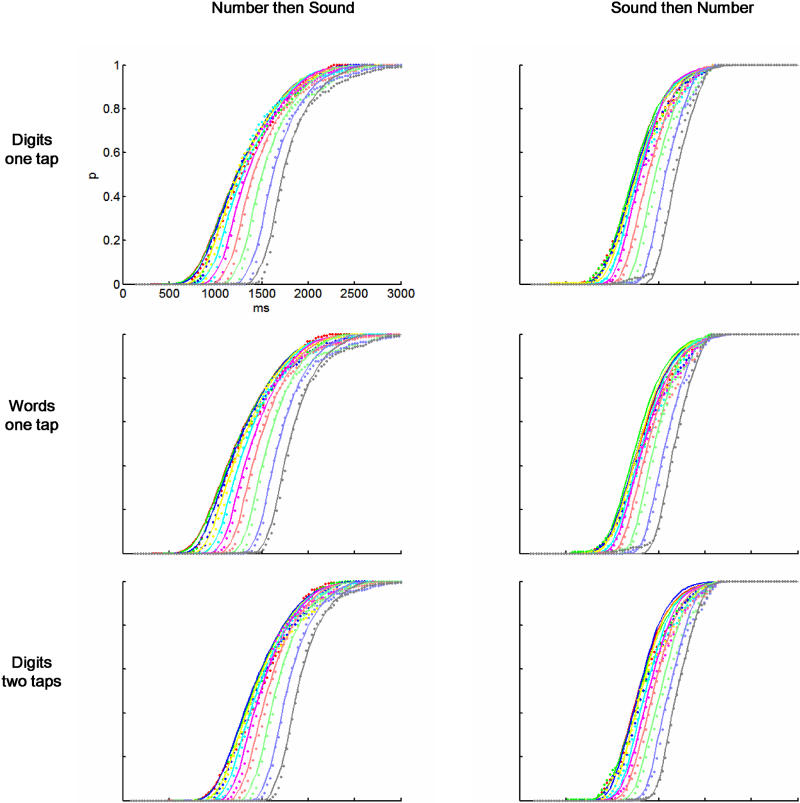
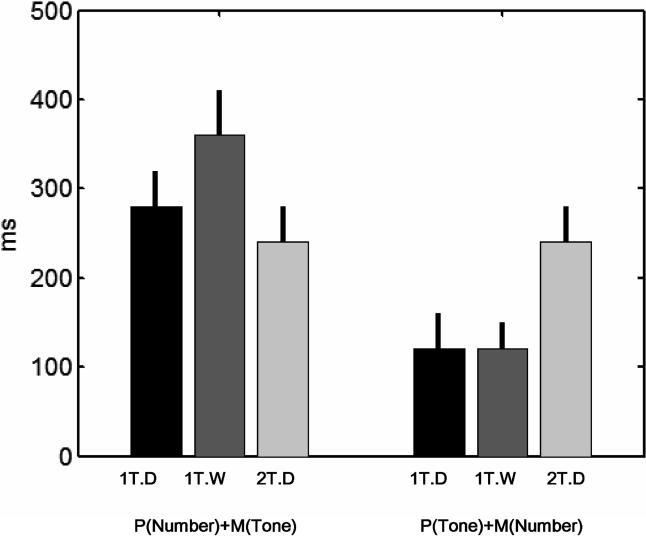
Parsing a mental operation into components, characterizing the parallel or serial nature of this flow, and understanding what each process ultimately contributes to response time are fundamental questions in cognitive neuroscience. Here we show how a simple theoretical model leads to an extended set of predictions concerning the distribution of response time and its alteration by simultaneous performance of another task. The model provides a synthesis of psychological refractory period and random-walk models of response time. It merely assumes that a task consists of three consecutive stages-perception, decision based on noisy integration of evidence, and response-and that the perceptual and motor stages can operate simultaneously with stages of another task, while the central decision process constitutes a bottleneck. We designed a number-comparison task that provided a thorough test of the model by allowing independent variations in number notation, numerical distance, response complexity, and temporal asynchrony relative to an interfering probe task of tone discrimination. The results revealed a parsing of the comparison task in which each variable affects only one stage. Numerical distance affects the integration process, which is the only step that cannot proceed in parallel and has a major contribution to response time variability. The other stages, mapping the numeral to an internal quantity and executing the motor response, can be carried out in parallel with another task. Changing the duration of these processes has no significant effect on the variance.


Figures

Figure 1
Figure 1. The Model: The Process of Accumulation of Evidence Constitutes the Mind's Bottleneck
Each task involves a sequence of three stages of processing. The perceptual and motor stages are fixed and can be carried out in parallel with stages of another task, while the central stage consists of a noisy integration (a random walk) until a decision threshold is reached. The central stage of task 2 cannot start until the central stage of task 1 is finished. Thus, this establishes a bottleneck and characterizes a serial process. The distribution of RTs for the second task is wider than that for the first task, because it combines the intrinsic variance of task 2 (the time to reach threshold) and the variance in onset of the central stage of task 2, which is set by the ending of the central stage of task 1.
Figure 2
Figure 2. Effects of the Different Manipulations on the Mean and Dispersion of RT
(A) Changes in the mean RT of the numeric task when it comes first in the different experimental manipulations. Changing the notation or the response complexity makes mean RT slower, and within each condition, responses are slower for close than for far distances. The difference between far and close conditions is independent of the experimental manipulation, indicating an additive effect that is tested in the ANOVAs (see Table 2). (B) A different pattern is observed for the interquartile range, which provides a measure of dispersion. While distance manipulation results in a major change of the interquartile range, there is not a major effect of notation or response complexity.
Figure 3
Figure 3. Description of the Task and Sketch of the PRP Model and Its Predictions
(A) Scheme of the main PRP effect. The vertical axis labels RT. The column on the left indicates the first task, and each coloured box within the column represents a different stage of processing: P component (dark green), C component (red), and M component (blue). The series of columns on the right indicate the processing time for task 2 at different delays (Δ), labelled on the x-axis. For each column, the three different boxes represent the three different stages of task 2: P component (green), C component (orange), and M component (cyan). As Δ progresses, the P component starts later. All components can be performed in parallel except for the C component, which establishes a bottleneck. This results in the following predictions: (1) response to the first task is independent of Δ, and (2) the RT2 (from onset of the trial) represented by the black line, is unchanged for small Δ while at sufficiently large Δ (noninterference regime) it increases linearly, with a slope of one, with Δ. (B) The predicted RT1 and RT2 (from trial onset) as a function of Δ is represented by the grey and black lines, respectively. (C) The model also establishes definite predictions for experiments in which one of the tasks is changed. The six different panels indicate all possible manipulations: first task changed (left column) or second task changed (right column) and whether the change affects the P component (first row), C component (middle row), or M component (bottom row). The changed component is labelled with a highlighted box and with an arrow. For simplicity, we assumed that the task manipulation always increases the duration of one component. RTs before the manipulation (which are the same across all panels) are represented with a solid line, grey for RT1 and black for RT2, and the RTs of the manipulated task are labelled with a dotted line with the same colour code. If the first task is changed (left column), different effects are observed depending on whether the change is in the M component or in the P–C components (which cannot be distinguished with this manipulation). If the M component is affected (bottom row), RT1 changes, but the response to the second task is unchanged. If the locus of the change is in either the P or the C component (middle and top rows), there is a larger delay until execution of task 2 and the following effect is observed: for small Δ (interference regime), RTs are increased and the regime of interference is increased, which is indicated by a shift of the kink to the right. If the second task is changed (right column), different effects are observed depending on whether the change is in the P component or in either the C or M component. If the change is in the P component (top row), for small Δ there is no net change in the response to the second task (because there was a wait at the end of the P component so extending it does not change total time execution), but there is less wait and thus the kink is shifted to the left. If the change is made in either the C or M component (middle and bottom rows) the result is a rigid shift, which is independent of Δ. By performing experiments in which the two tasks are presented in different orders, all task components can be differentiated. All task manipulations, according to the PRP model, should fall into one of the three categories, perceptual, central, or motor, each defined by its characteristic RT signature.
Figure 4
Figure 4. Dissociating P, C, and M Components by Their Interference Patterns
In the left column the number task is performed first and the tone task second. In the right column the tone task is performed first and the number task second. In both cases, the number task is manipulated by the three factors of notation, distance, and response complexity. In all panels the code is identical: RT1is coloured grey while RT2 is coloured black. The “easy” condition is represented by a solid line and the “difficult” condition by a dotted line. All the data can be explained in terms of the PRP model: notation (top row) affects the P component, distance (middle row) affects C, and response complexity (bottom row) affects M (see also Tables 4–6 for statistics, and note the agreement with the predicted RTs shown in Figure 3).
Figure 5
Figure 5. Dissociating Parallel and Serial Components by RT Distributions
(A) RT histograms (when the number task was presented first) fitted by a simple random-walk model, separately for far distances (left column) and close distances (right column) and for the three different tasks: Digits 1 Tap (top row), Words 1 Tap (middle row), and Digits 2 Taps (bottom row). (B) Cumulative plots of the same data. The effect of both notation and response appears to be a shift of the distribution to the right while the distance effect is a change in the slope. Within each panel, we have overlapped the corresponding fit (blue line) and the fit to the easiest condition—Digits 1 Tap, Far Digits (red line)—to make the change between the different distributions apparent. (C) The two fitted values (fixed delay and integration time) as a function of numerical distance for the three different tasks. The integration time decreases with distance, but it is independent of the tasks. In contrast, the fixed delay does not change with distance but changes with the task. The summed delay plus integration time fit the mean reaction times for each distance (solid circles). (D) Statistics performed on the fit reveal that the fixed delay has a slope not significantly different from zero (i.e., it does not depend on distance), but it changes with task. In contrast, the integration time is significantly different from zero, but it does not change with task.
Figure 6
Figure 6. Predicting the Distribution of RTs to the Second Task from the PRP Model
Left: Cumulative plots of RTs to the number task when it is presented second (dots) and the predicted distribution based on the PRP model (solid lines). Each curve (coded in different colours) represents one of the ten possible values of Δ. Right: Same data for RTs to the tone task when it is presented second (dots) and the predicted distribution from the PRP model (solid lines). Each row corresponds to a different task: Digits 1 Tap (first row), Digits 2 Taps (second row), and Words 1 Tap (third row). Each panel was fit with three parameters: M1, P2, and a fixed delay.
Figure 7
Figure 7. Parameters Obtained from the PRP Fitting and Their Task Dependence
The PRP fitting allowed us to estimate the values of P2 + M1. Depending on which task is presented first, we can calculate P(Number) + M(Tone) (left bars) or P(Tone) + M(Number) (right bars). P(Number) + M(Tone) changes with notation manipulation but not with response manipulation. Conversely, P(Tone) + M(Number) changes with response manipulation but not with the notation manipulation. Furthermore, the left bars are consistently higher than the right bars, suggesting that visual perception of digits and words takes approximately 150–220 ms longer than auditory perception of a single tone.

Comment in

References

    1. Descartes R. Traité de l'homme. Descartes: Oeuvres et lettres. Paris: Gallimard; 1937. 1,421 pp.
    1. Sherrington C. The integrative action of the nervous system. New Haven: Yale University Press; 1906. 413 pp.
    1. Pavlov IP. Conditioned reflexes: An investigation of the physiological activity of the cerebral cortex. Oxford: Oxford University Press; 1927. 430 pp. - PMC - PubMed
    1. Posner MI. Chronometric explorations of mind. Hillsdale (New Jersey): L. Erlbaum Associates; 1978. 271 pp.
    1. Sternberg S. The discovery of processing stages: Extension of Donders' method. In: Koster WG, editor. Attention and performance II. Amsterdam: North-Holland Publishing. pp. 1969:276–315.

Publication types