. 2004 Nov-Dec;6(6):831-7.
doi: 10.1593/neo.03343.

Changes in water mobility measured by diffusion MRI predict response of metastatic breast cancer to chemotherapy

Affiliations

Changes in water mobility measured by diffusion MRI predict response of metastatic breast cancer to chemotherapy

Rebecca J Theilmann et al. Neoplasia. 2004 Nov-Dec.

Abstract

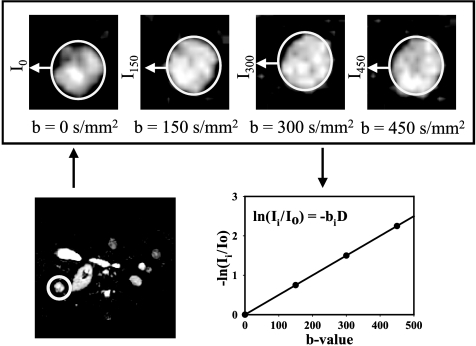
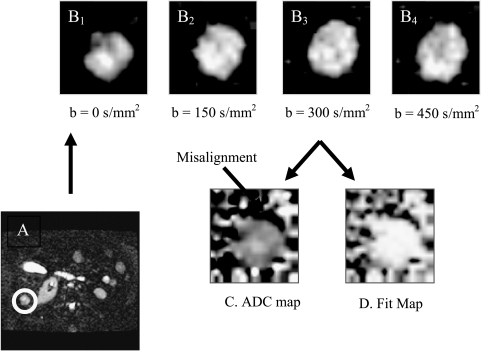
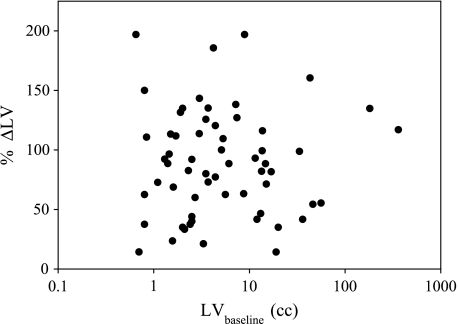
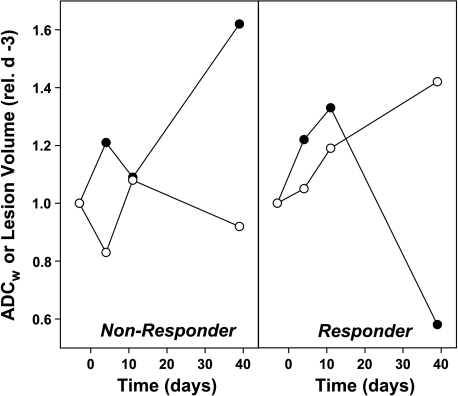
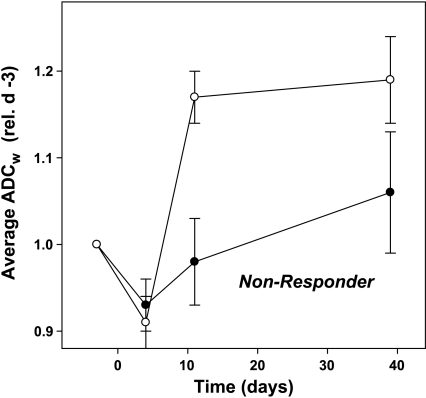
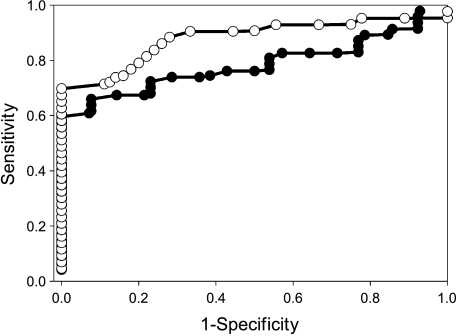
The goal of oncology is the individualization of patient care to optimize therapeutic responses and minimize toxicities. Achieving this will require noninvasive, quantifiable, and early markers of tumor response. Preclinical data from xenografted tumors using a variety of antitumor therapies have shown that magnetic resonance imaging (MRI)-measured mobility of tissue water (apparent diffusion coefficient of water, or ADCw) is a biomarker presaging cell death in the tumor. This communication tests the hypothesis that changes in water mobility will quantitatively presage tumor responses in patients with metastatic liver lesions from breast cancer. A total of 13 patients with metastatic breast cancer and 60 measurable liver lesions were monitored by diffusion MRI after initiation of new courses of chemotherapy. MR images were obtained prior to, and at 4, 11, and 39 days following the initiation of therapy for determination of volumes and ADCw values. The data indicate that diffusion MRI can predict response by 4 or 11 days after commencement of therapy, depending on the analytic method. The highest concordance was observed in tumor lesions that were less than 8 cm3 in volume at presentation. These results suggest that diffusion MRI can be useful to predict the response of liver metastases to effective chemotherapy.


Figures

Figure 1
Figure 1
Representative images. Echoplanar diffusion-weighted images from patient with breast cancer metastases. A full torso image is shown in the lower left, wherein a metastatic lesion in the liver is delineated with circle. The upper figures show the lesion images from the same slice obtained at b values from 0 to 450 sec/mm2. In these images, the display gains have been increased so as to scale to the brightest spot in each image. The actual intensities decrease as shown in the plot. The natural log of the average signal intensity within the ROI relative to b = 0 was expressed as a function of b value to calculate the apparent diffusion coefficient ADCw (denoted as D in the figure).
Figure 2
Figure 2
Pixel-by-pixel ADC calculations. Slice from torso image (A) was used to identify lesions, demarcated by circle. Lesion images were obtained at b values from 0 to 450 sec/mm2 (B1–B4). Individual pixels were fit to obtain ADC values using Eq. (1), assuming perfect interimage registration. As above, the display gains have been adjusted to the brightest spot in each image. This resulted in a dark crescent at the edge of the ADC map (C), suggesting misalignment of pixels between scans at different b values. This was confirmed using a map of the correlation coefficients (D) wherein the bright values had higher r2 values (white > 0.90). This map also showed that the dark crescent in (C) coregistered with the low r2 values in (D).
Figure 3
Figure 3
Relationship between pretherapy LV and clinical response. The LV at presentation (LVbaseline) was determined manually by circumscribing lesions on SSFSE images. The objective clinical response was determined by calculating the change in LVs between presentation and day 39 following commencement of therapy (%ΔLV). As shown, there is no correlation between LV and response (r = 0.13).
Figure 4
Figure 4
Representative responses. Changes in the ADCw (○) and volumes (●) for single lesions in a nonresponding patient and a responding patient. ADCw values were calculated from ROI analyses, as described in the Materials and Methods section. LVs were calculated from SSFSE images obtained in the same session. Data are expressed relative to the values at baseline.
Figure 5
Figure 5
Distribution of ADCw values for nonresponders and responders and volumes. Patients with positive responses or stable disease (classes 3–5) were grouped as responders (○), and those in classes 1 and 2 were grouped as nonresponders (●). Data show ADCw values (± SD) normalized to the individual pretherapy baseline ADCw for each patient. Data points are shown for baseline, day 4 (P = .312), day 11 (P = .066), and day 39 (P = .074).
Figure 6
Figure 6
ROC curves. ROC for day 4 (●) and day 11 (○) posttherapy. Lesions were identified as responders or nonresponders, and the changes in ADCw were rank-ordered. At each value of percent change in ADCw, the numbers of responders at higher values were classified as true positives (TP) and the number of nonresponders were false positives (FP). At all lower values, the numbers of nonresponders at lower values were true negatives (TN) and the numbers of responders were false negatives (FN). The areas under the curve for each analysis were 0.84 on day 4 and 0.91 on day 11.

References

    1. He Z, Evelhoch JL, Mohammad RM, Adsay NV, Pettit GR, Vaitkevicius VK, Sarkar FH. Magnetic resonance imaging to measure therapeutic response using an orthotopic model of human pancreatic cancer. Pancreas. 2000;21:69–76. - PubMed
    1. Poptani H, Duvvuri U, Miller CG, Mancuso A, Charagundla S, Frase NW, Glickson JD, Leigh JS, Reddy R. T1rho imaging of murine brain tumors at 4 T. Acad Radiol. 2001;8:42–47. - PubMed
    1. Evelhoch JL, Gillies RJ, Karczmar GS, Koutcher JA, Maxwell RJ, Nalcioglu O, Raghunand N, Ronen SM, Ross BD, Swartz HM. Applications of magnetic resonance in model systems: cancer therapeutics. Neoplasia (New York) 2000;2:152–165. - PMC - PubMed
    1. Aboagye EO, Bhujwalla ZM, He Q, Glickson JD. Evaluation of lactate as a 1H nuclear magnetic resonance spectroscopy index for noninvasive prediction and early detection of tumor response to radiation therapy in EMT6 tumors. Radiat Res. 1998;150:38–42. - PubMed
    1. Zhao M, Pipe JG, Bonnett J, Evelhoch JL. Early detection of treatment response by diffusion-weighted 1H-NMR spectroscopy in a murine tumor in vivo. Br J Cancer. 1996;73:61–64. - PMC - PubMed

LinkOut - more resources