

Characteristics of stem cells from human neuroblastoma cell lines and in tumors
- PMID: 15720811
- PMCID: PMC1531688
- DOI: 10.1593/neo.04310
Characteristics of stem cells from human neuroblastoma cell lines and in tumors
Abstract
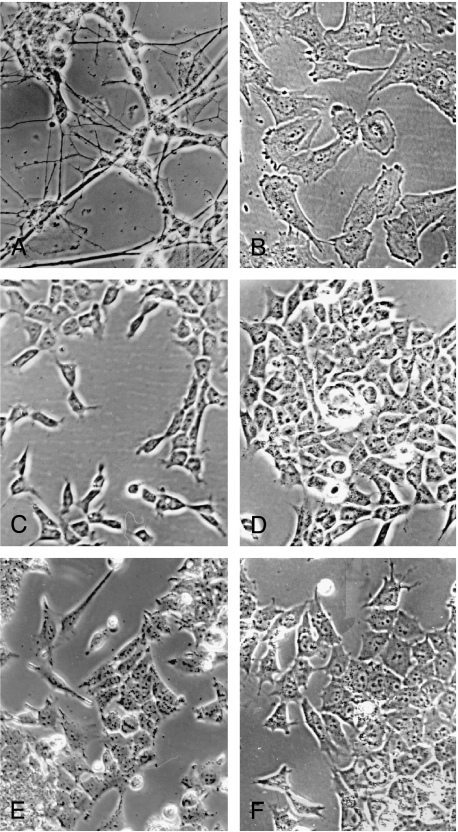
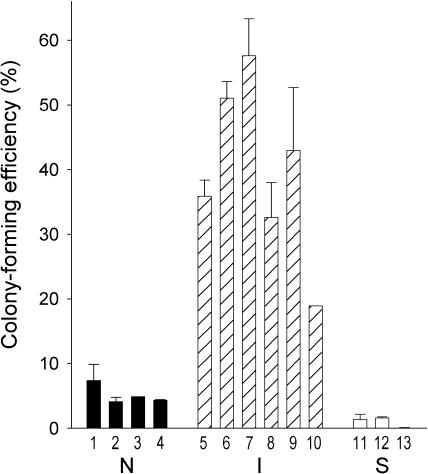
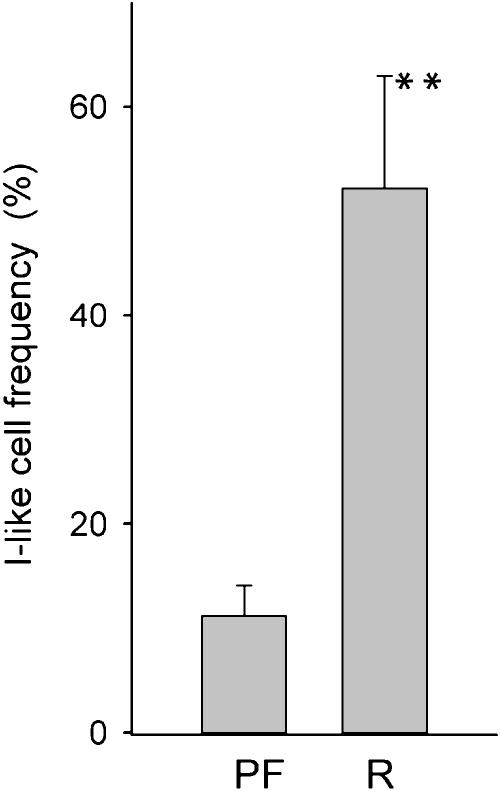
Cellular heterogeneity is a hallmark of human neuroblastoma tumors and cell lines. Within a single neuroblastoma are cells from distinct neural crest lineages whose relative abundance is significant for prognosis. We postulate that a self-renewing multipotent tumor stem cell, which gives rise to diverse cell lineages, is the malignant progenitor of this cancer. To test this hypothesis, we have established 22 cloned, phenotypically homogeneous populations of the three major cell types from 17 neuroblastoma cell lines. In vitro, malignant neuroblastoma stem cells, termed I-type (intermediate type), have distinct morphologic, biochemical, differentiative, and tumorigenic properties. I-type cells express features of both neuroblastic (N) cells (scant cytoplasm, neuritic processes, neurofilaments, pseudoganglia, and granin and neurotransmitter enzyme expression) and substrate-adherent (S) cells (extensive cytoplasm and vimentin and CD44 expression). Moreover, they show bidirectional differentiation to either N or S cells when induced by specific agents. I-type cells are significantly more malignant than N- or S-type cells, with four- to five-fold greater plating efficiencies in soft agar and six-fold higher tumorigenicity in athymic mice. Differences in malignant potential are unrelated to N-myc amplification/overexpression or the ability to digest and migrate through the extracellular matrix. Immunocytochemical analyses of a small series of tumors reveal that frequency of cells coexpressing N and S cell markers correlates with poor prognosis. Thus, I-type stem cells may be instrumental in the genesis and growth of tumors in the patient. Their unique biology deserves attention and further investigation.
Figures
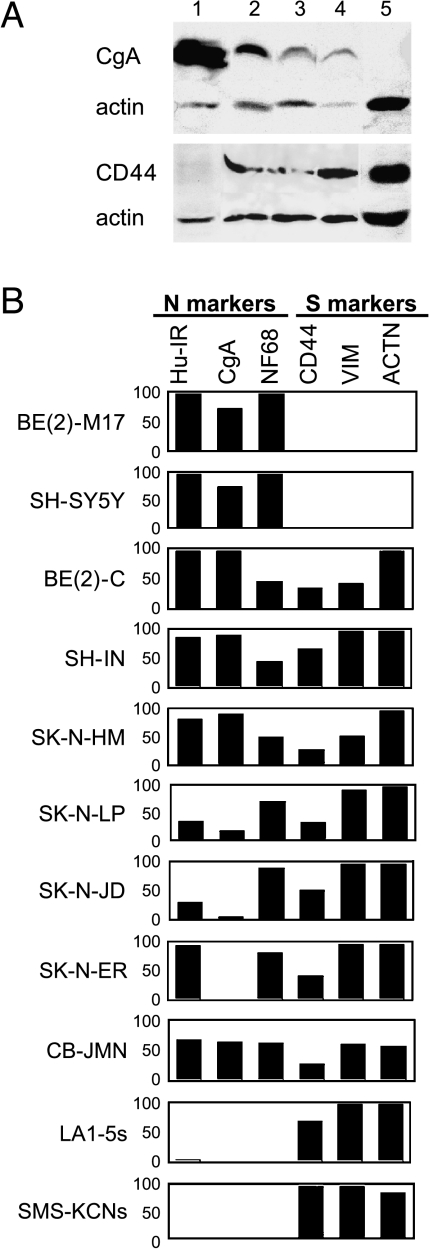
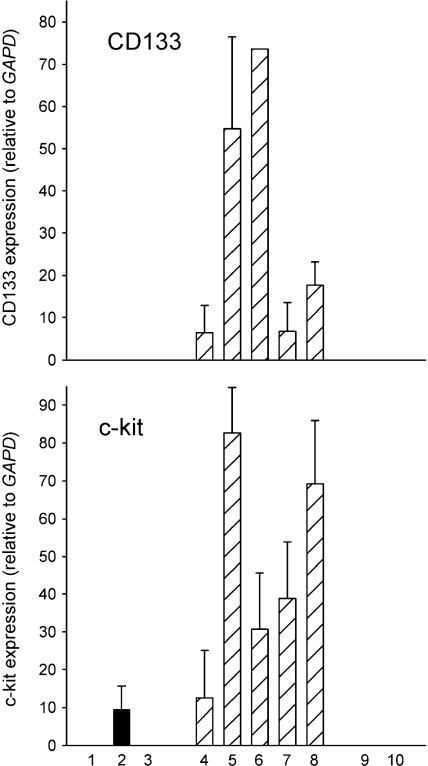
 ), and two S-type (□) human neuroblastoma cell lines. Each bar represents the average of one to five separate determinations. Lane, line: (1) KCN-69n; (2) LA1-55n; (3) BE(2)-M17; (4) BE(2)-C; (5) SK-N-LP; (6) LAN-2; (7) CB-JMN; (8) SK-N-ER; (9) SH-EP1, and (10) LA1-5s.
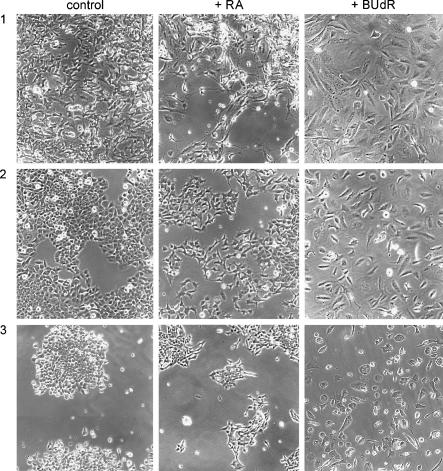
References
-
- Castleberry RP. Biology and treatment of neuroblastoma. Pediatr Clin North Am. 1997;44:919–937. - PubMed
-
- Matthay KK. Neuroblastoma: biology and therapy. Oncology. 1997;11:1857–1866. - PubMed
-
- Brodeur GM. Neuroblastoma: biological insights into a clinical enigma. Nat Rev Cancer. 2003;3:203–216. - PubMed
-
- Shimada H, Umehara S, Monobe Y, Hachitanda Y, Nakagawa A, Goto S, Gerbing RB, Stram DO, Lukens JN, Matthay KK. International neuroblastoma pathology classification for prognostic evaluation of patients with peripheral neuroblastic tumors. Cancer. 2001;92:2451–2461. - PubMed
-
- Rettig WJ, Spengler BA, Garin Chesa P, Old LJ, Biedler JL. Coordinate changes in neuronal phenotype and surface antigen expression in human neuroblastoma cell variants. Cancer Res. 1987;47:1383–1389. - PubMed
Publication types
MeSH terms
Substances
Grants and funding
LinkOut - more resources
Full Text Sources
Other Literature Sources
Medical
Research Materials
Miscellaneous