

A new system for the automatic estimation of endothelial cell density in donor corneas
- PMID: 15722310
- PMCID: PMC1772560
- DOI: 10.1136/bjo.2004.051722
A new system for the automatic estimation of endothelial cell density in donor corneas
Abstract
Aims: The problem of automatic estimation of endothelial cell density from microscopy images in donor corneas was addressed.
Methods: The spatial frequencies contained in digital endothelium images are extracted with a two dimension discrete Fourier transform (DFT) technique. A circular band in the DFT of the images is shown to contain the frequency information related to the cell density. An algorithm for reliably recovering this spatial frequency information and for extracting from it an estimate of endothelial cell density has been developed and implemented in a computer program. An evaluation was performed on a data set containing 100 donor corneas, by comparing automatic values with manual counts performed by three eye bank experts on two images for each cornea.
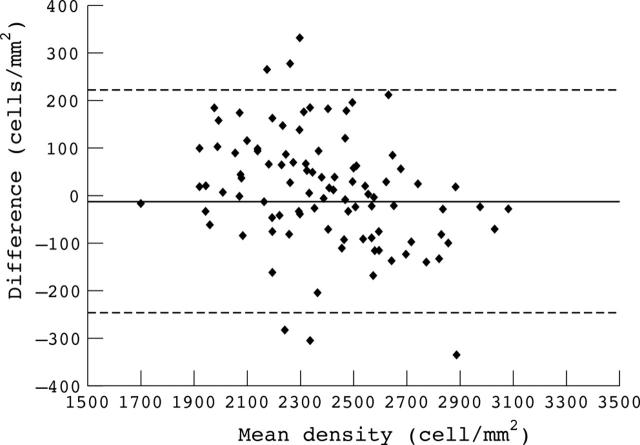
Results: The mean difference of automatic densities v manual ones was 14 cells/mm(2) (0.9%), with a standard deviation of 119 cells/mm(2) (5.1%) and mean absolute difference of 92 cells/mm(2) (3.9%). The ANOVA based overall inter-rater reliability was 0.935. The algorithm was also capable of identifying all non-processable images. Running times were in the order of 1-2 seconds per image.
Conclusion: A new algorithm was developed for the fully automatic estimation of endothelial cell density. The results of a clinical evaluation on 100 corneas suggest that it is capable of reliably estimating endothelium cell density in donor corneas.
Figures


Similar articles
-
Evaluation of repeatability for the automatic estimation of endothelial cell density in donor corneas.Br J Ophthalmol. 2007 Sep;91(9):1213-5. doi: 10.1136/bjo.2006.112763. Epub 2007 Apr 12. Br J Ophthalmol. 2007. PMID: 17431018 Free PMC article.
-
Automatic estimation of endothelium cell density in donor corneas by means of fourier analysis.Med Biol Eng Comput. 2004 Sep;42(5):725-31. doi: 10.1007/BF02347557. Med Biol Eng Comput. 2004. PMID: 15503976
-
A system for the automatic estimation of morphometric parameters of corneal endothelium in alizarine red-stained images.Br J Ophthalmol. 2010 May;94(5):643-7. doi: 10.1136/bjo.2009.166561. Br J Ophthalmol. 2010. PMID: 20447967
-
Endothelial cell density in donor corneas: a comparison of automatic software programs with manual counting.Cornea. 2007 Jan;26(1):80-3. doi: 10.1097/ICO.0b013e31802be629. Cornea. 2007. PMID: 17198018
-
Endothelial evaluation in the cornea bank.Dev Ophthalmol. 2009;43:47-62. doi: 10.1159/000223838. Epub 2009 Jun 3. Dev Ophthalmol. 2009. PMID: 19494636 Review.
Cited by
-
Corneal endothelium assessment in specular microscopy images with Fuchs' dystrophy via deep regression of signed distance maps.Biomed Opt Express. 2022 Dec 19;14(1):335-351. doi: 10.1364/BOE.477495. eCollection 2023 Jan 1. Biomed Opt Express. 2022. PMID: 36698671 Free PMC article.
-
In vivo corneal endothelium imaging using ultrahigh resolution OCT.Biomed Opt Express. 2019 Oct 11;10(11):5675-5686. doi: 10.1364/BOE.10.005675. eCollection 2019 Nov 1. Biomed Opt Express. 2019. PMID: 31799039 Free PMC article.
-
Automatic segmentation of closed-contour features in ophthalmic images using graph theory and dynamic programming.Biomed Opt Express. 2012 May 1;3(5):1127-40. doi: 10.1364/BOE.3.001127. Epub 2012 Apr 26. Biomed Opt Express. 2012. PMID: 22567602 Free PMC article.
-
Fully automatic evaluation of the corneal endothelium from in vivo confocal microscopy.BMC Med Imaging. 2015 Apr 26;15:13. doi: 10.1186/s12880-015-0054-3. BMC Med Imaging. 2015. PMID: 25928199 Free PMC article.
-
Mobile-CellNet: Automatic Segmentation of Corneal Endothelium Using an Efficient Hybrid Deep Learning Model.Cornea. 2023 Apr 1;42(4):456-463. doi: 10.1097/ICO.0000000000003186. Epub 2022 Dec 12. Cornea. 2023. PMID: 36633942 Free PMC article.
References
-
- Bourne WM. Examination and photography of donor corneal endothelium. Arch Ophthalmol 1976;94:1799–800. - PubMed
-
- Lester JM, MacFarland JL, Bursell SE, et al. Automated morphometric analysis of corneal endothelial cells. Invest Ophthalmol Vis Sci 1981;20:407–10. - PubMed
-
- Hirst LW, Sterner RE, Grant DG. Automated analysis of wide-field specular photomicrographs. Cornea 1984;3:83–7. - PubMed
-
- Schultz RO, Matsuda M, Yee RW, et al. Corneal endothelium changes in type I and type II diabetes mellitus. Am J Ophthalmol 1984;98:401–10. - PubMed
-
- Hartmann C, Köditz W. Automated morphometric endothelial analysis combined with video specular microscopy. Cornea. 1985 1984;3:155–67. - PubMed
Publication types
MeSH terms
LinkOut - more resources
Full Text Sources
Other Literature Sources