. 2005 May;88(5):3625-34.
doi: 10.1529/biophysj.104.054056. Epub 2005 Feb 18.

Identification of plasma membrane macro- and microdomains from wavelet analysis of FRET microscopy

Affiliations

Identification of plasma membrane macro- and microdomains from wavelet analysis of FRET microscopy

Evgeny Kobrinsky et al. Biophys J. 2005 May.

Abstract

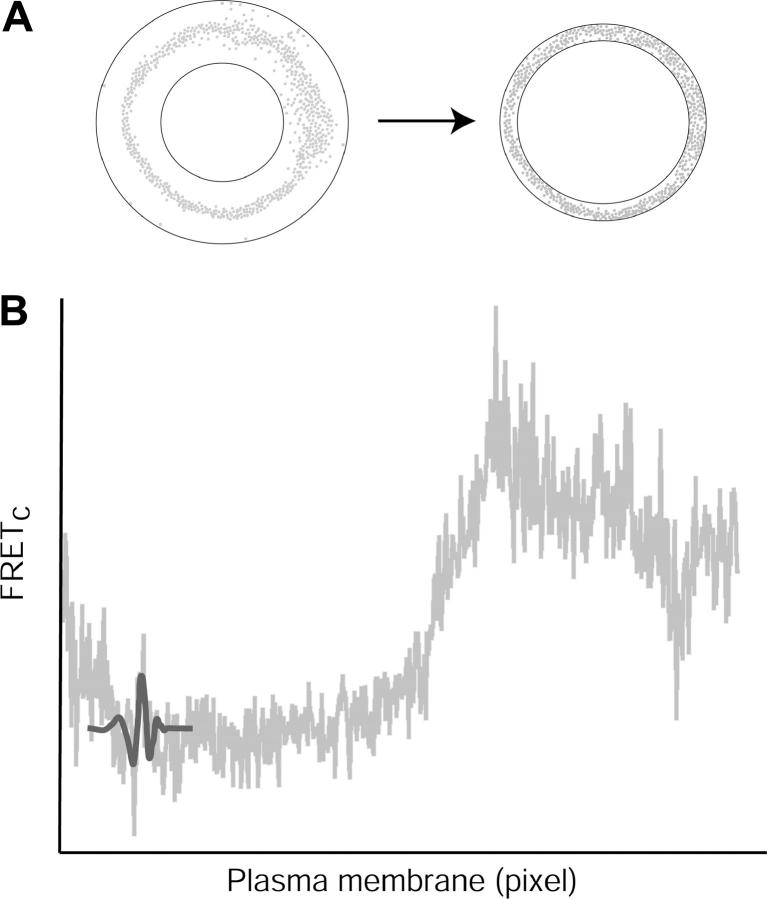
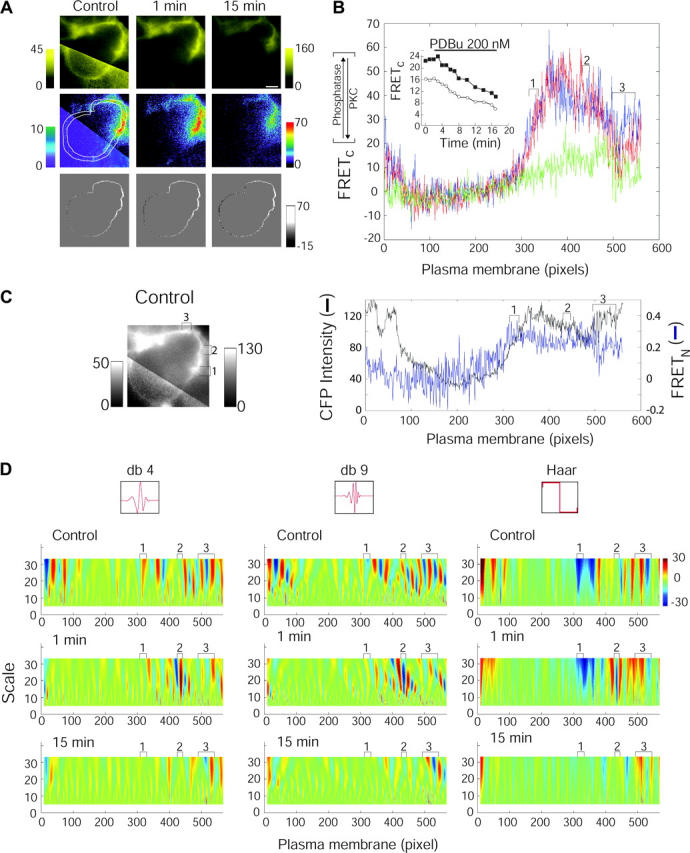
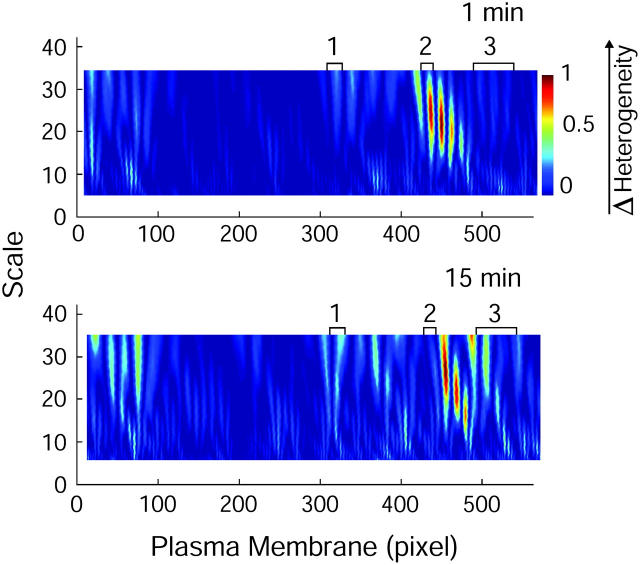
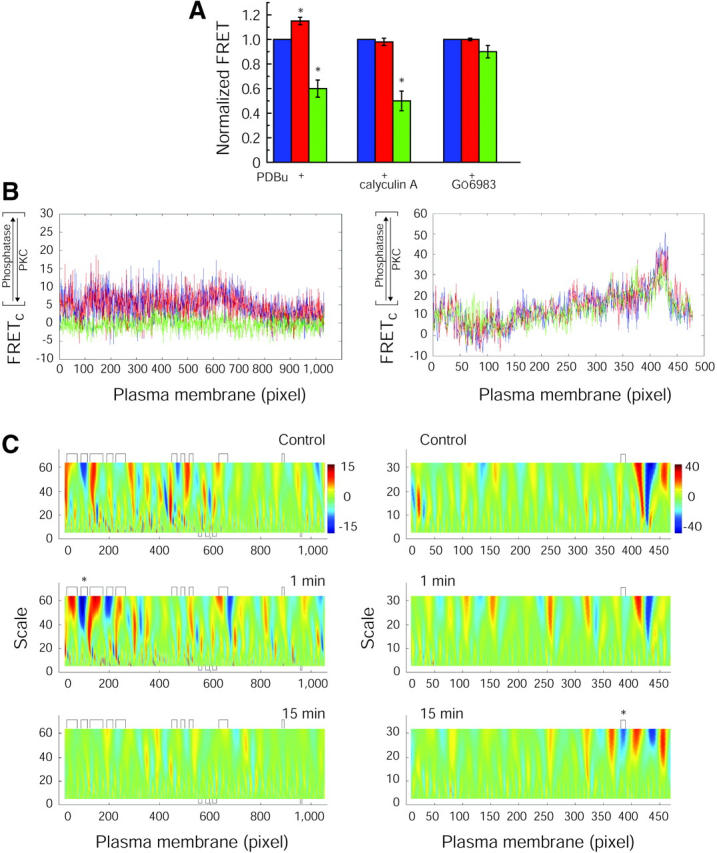
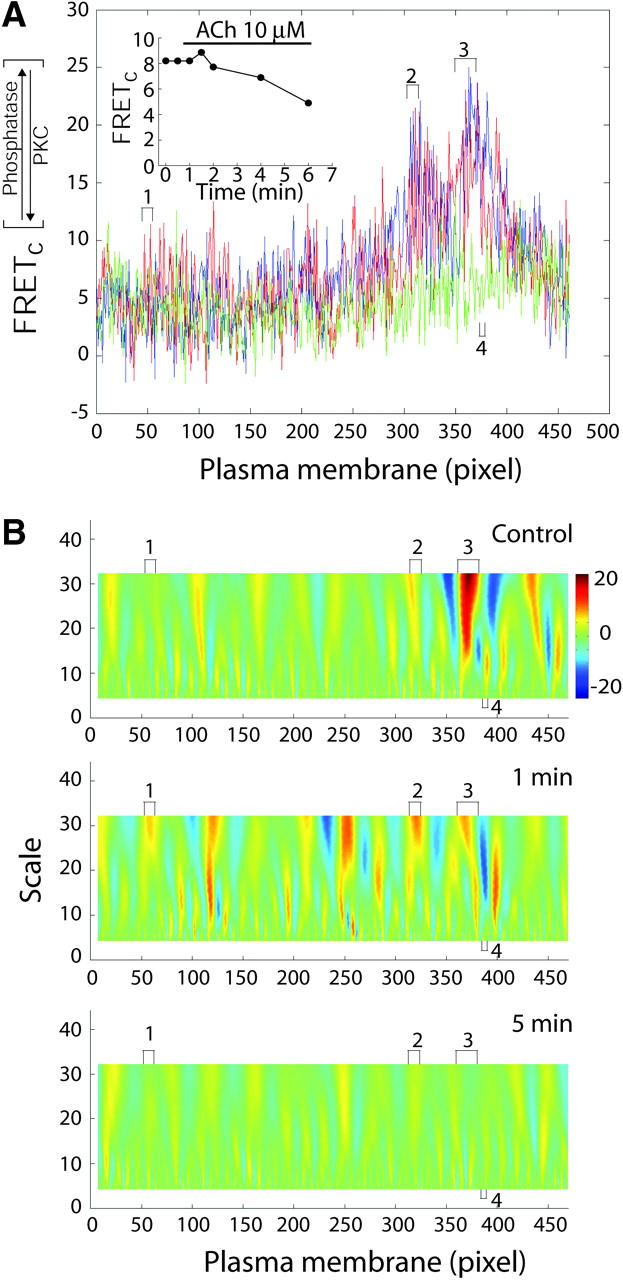
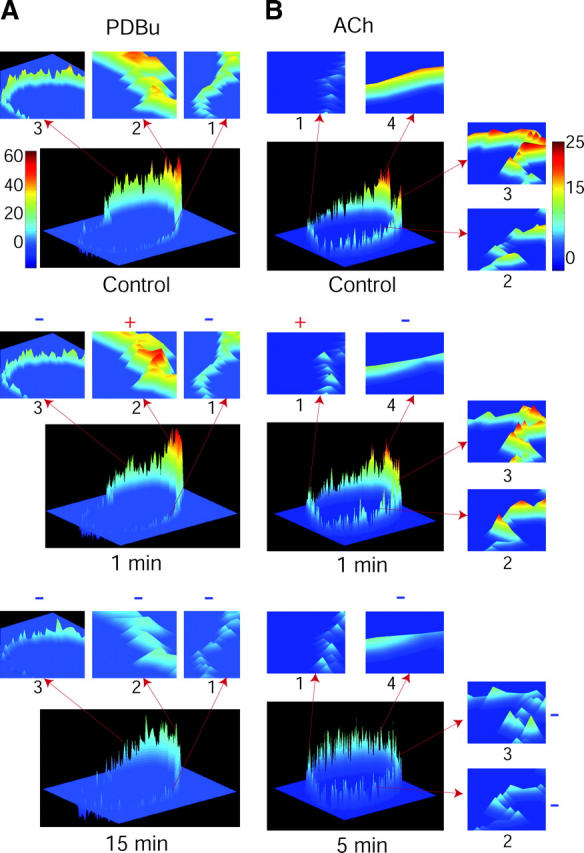
In this study, we sought to characterize functional signaling domains by applying the multiresolution properties of the continuous wavelet transform to fluorescence resonance energy transfer (FRET) microscopic images of plasma membranes. A genetically encoded FRET reporter of protein kinase C (PKC)-dependent phosphorylation was expressed in COS1 cells. Differences between wavelet coefficient matrices revealed several heterogeneous domains (typically ranging from 1 to 5 microm), reflecting the dynamic balance between PKC and phosphatase activity during stimulation with phorbol-12,13-dibutyrate or acetylcholine. The balance in these domains was not necessarily reflected in the overall plasma membrane changes, and observed heterogeneity was absent when cells were exposed to a phosphatase or PKC inhibitor. Prolonged exposure to phorbol-12,13-dibutyrate and acetylcholine yielded more homogeneous FRET distribution in plasma membranes. The proposed wavelet-based image analysis provides, for the first time, a basis and a means of detecting and quantifying dynamic changes in functional signaling domains, and may find broader application in studying fine aspects of cellular signaling by various imaging reporters.


Figures

FIGURE 1
FIGURE 1
Schematic of wavelet analysis of FRET microscopy. (A) ROIm (left panel, two solid circles) localizing clear instances of FRET signal (shaded dots) are then narrowed-down (right panel) by statistically comparing, pixel-by-pixel, control and stabilized images where maximum changes in FRET signal have been observed. (B) Corrected FRET values in redefined ROI (A, right) are transformed into linearized one-dimensional signals for texture and wavelet analysis. Wavelet analysis involves comparing a scaled wavelet basis function (db4 wavelet is shown in solid representation) to the signal, an amplitude coefficient is calculated, and then the wavelet is shifted along the x axis (space) and continues across the duration of the signal. The wavelet is then rescaled (corresponding to new frequency) and the process is repeated. This procedure results in a matrix of wavelet coefficients that co-localize in space and frequency and is summarized by Eq. 7.
FIGURE 2
FIGURE 2
Wavelet analysis of PDBu-induced PKC activation in COS1 cells expressing the CKAR . (A) Progression from original FRET images to FRETc images within redefined plasma membrane ROIs. FRET images of a COS1 cell obtained before (control) and after 1 (transient increase in FRET) or 15 min (stable decrease of FRET) of application of 200 nM PDBu (top panels), and corresponding FRETc images (middle panels, white lines show ROIm), and shaded images of FRETc within redefined plasma membrane ROIs (bottom panels). The top control image is shown in two different intensity scales to illustrate the cell plasma membrane continuity (left scale applies to the bottom part of the image). Scale bar is 3 μm. (B) FRETc values in the linearized plasma membrane ROIs in control before (blue), and after 1 min (red) and 15 min (green) of PDBu application. (Inset) The time-dependence of FRETc values averaged over the plasma membrane ROI after activation of PKC in the manually (open circles) and statistically defined (solid squares) plasma membrane region. Both time-dependencies indicate a transient increase of CKAR FRET (1 min) followed by a continuous decrease of the FRETc signal. Decrease in FRETc was due to phosphorylation of the substrate part of CKAR by PKC. Brackets show db4 statistically defined signaling microdomains (see below). (C) Image of a CKAR-expressing COS1 cell obtained under control conditions with the CFP filter (left). Plasma membrane intensity profile obtained with the CFP filter, representing the spatial heterogeneity in the CKAR expression level (solid line), and FRET normalized by the level of expression (FRETN, blue line) are shown on the right. (D) Comparison of wavelet coefficients from a CWT analysis (values represented according to color bar) using db4, db9, and Haar wavelets at different timepoints (0, 1, and 15 min ) of PDBu application in linearized plasma membrane (in pixels). At scale (see y axis) 5, the standard deviations of the coefficients were 5.02, 5.37, and 4.15 in control, 1-, and 15-min PDBu application for db4, respectively. Likewise at scale 32 (db4), the corresponding standard deviations were 11.1, 7.09, and 6.40. Scale (y axis) theoretically reflects the sampling period of the signal and is represented without reference to units. Domains defined by one-way ANOVA with Dunnett's multiple comparisons test are shown with brackets and correspond to those in B.
FIGURE 3
FIGURE 3
Subtraction of wavelet coefficient matrices as a tool for highlighting the heterogeneity of the plasma membrane domains. Subtraction of the 1-min (top panel) and 15-min timepoint (bottom panel) wavelet coefficient matrices from the control matrix, where the original matrices are shown in Fig. 2 D (db4). Subtraction of each matrix coefficient was done according to formula image where D is the difference between the wavelet coefficient matrices at different timepoints (t), CC is the coefficient matrix under control conditions, and Ct is the coefficient matrix after timepoints of PDBU action. Dt was normalized to the maximal value (see color bar).
FIGURE 4
FIGURE 4
Transient phosphatase activation is sensitive to a phosphatase and PKC inhibitors, but the sustained PKC-induced phosphorylation is sensitive to only the PKC inhibitor. (A) Bar histogram showing the PDBu effect on normalized FRET values of CKAR reporter in the absence or in the presence of the inhibitors of phosphatase (calyculin A, 100 nM) or PKC (Gö6983, 1 μM). Colors correspond to control (blue) and 1- (red) and 15-min (green) timepoints of PDBu (200 nM) exposure. Normalized FRET increased to 1.15 ± 0.03 (p < 0.05; n = 3) after 1 min of PDBu action. Incubation with calyculin A and Gö6983 abolished this transient increase to 0.98 ± 0.03 (n = 5) and 1.00 ± 0.01 (n = 3), respectively. After prolonged exposure to PDBu (15-min), FRET values were decreased to 0.6 ± 0.07 (p < 0.01; n = 3). Incubation with calyculin A did not influence this decrease (0.5 ± 0.08; p < 0.01; n = 5), but incubation with Gö6983 almost completely abolished the PKC-induced phosphorylation of the CKAR reporter (0.9 ± 0.05; n = 3). (B) FRETc values within the linearized plasma membrane of a representative COS1 cell expressing CKAR in the presence of calyculin A (left panel) or Gö6983 (right panel). Line colors correspond to the timepoints of the PDBu effect in the presence of calyculin A or Gö6983 in A. (C) Wavelet coefficient plots (values represented according to color bar) at control and after 1 and 15 min of PDBu exposure in the presence of calyculin A (left panel) or Gö6983 (right panel). All domains that were statistically significant at the 15 min PDBu effect, as revealed by the CWT, are indicated by brackets above and below the panels. In the presence of calyculin A, only one domain (marked with an asterisk) showed significant decrease in FRETc after 1-min exposure to PDBu, and no single domain showed a significant increase in FRETc. In the presence of Gö6983, only one domain showed a significant change at 15 min of PDBu exposure, and no domains exhibited significant changes at 1 min.
FIGURE 5
FIGURE 5
Activation of PKC by ACh (10 μM) in COS1 cells expressing CKAR and M1 muscarinic ACh receptor. (A) FRETc values in linearized plasma membrane ROIs in control (blue) and after 1-min (red) and 5-min (green) application of ACh. Inset shows changes in FRETc averaged over the plasma membrane ROIs. Decrease of FRETc values was due to phosphorylation of CKAR by PKC. (B) CWT analysis of FRETc in ROIs using the db4 wavelet (values represented according to color bar). Standard deviations of wavelet coefficients were 2.65, 3.02, and 2.25 (scale 5) and 5.88, 5.44, and 2.36 (scale 32) at control, 1, and 15 min, respectively.
FIGURE 6
FIGURE 6
Three-dimensional representation of PKC activity in the statistically defined plasma membrane domains of COS1 cells expressing CKAR. (A) PKC activation by 200 nM PDBu. (B) PKC activation by 10 μM ACh. Color bars of FRETc are shown for both cells. Arrows point to the numbered domains that correspond to those marked by brackets in Figs. 2 and 5. Significant relative changes from the control images in the mean FRETc values in these domains (marked by plus or minus symbols above or on the right side of the images of microdomains) are reported in Table 1. Whereas all domains show decreased FRETc intensity at 15- (PDBu) and 5-min (ACh) timepoints, a local heterogeneity was observed in the 1-min ROIs as several domains (1 and 3 in A, and 4 in B) responded oppositely to the average transient increases shown in Figs. 2 B and 5 A (insets).

Similar articles

Cited by

References

    1. Aristizabal, F., and M. I. Glavinovic. 2003. Wavelet analysis of nonstationary fluctuations of Monte Carlo-simulated excitatory postsynaptic currents. Biophys. J. 85:2170–2185. - PMC - PubMed
    1. Arneodo, A., E. Bacry, P. V. Graves, and J. F. Muzy. 1995. Characterizing long-range correlations in DNA sequences from wavelet analysis. Phys. Rev. Lett. 74:3293–3296. - PubMed
    1. Braz, J. C., K. Gregory, A. Pathak, W. Zhao, B. Sahin, R. Klevitsky, T. F. Kimball, J. N. Lorenz, A. C. Nairn, S. B. Liggett, I. Bodi, S. Wang, A. Schwartz, E. G. Lakatta, A. A. DePaoli-Roach, J. Robbins, T. E. Hewett, J. A. Bibb, M. V. Westfall, E. G. Kranias, and J. D. Molkentin. 2004. PKC-α regulates cardiac contractility and propensity toward heart failure. Nat. Med. 10:248–254. - PubMed
    1. Haralick, R. M., K. Shanmugam, and I. Dinstein. 1973. Textural features for image classification. IEEE Trans. 3:610–621.
    1. Kenworthy, A. K. 2001. Imaging protein-protein interactions using fluorescence resonance energy transfer microscopy. Methods. 24:289–296. - PubMed

Publication types

MeSH terms

Substances

LinkOut - more resources