. 2005 May;88(5):3689-98.
doi: 10.1529/biophysj.104.045476. Epub 2005 Feb 18.

Optical deformability as an inherent cell marker for testing malignant transformation and metastatic competence

Affiliations

Optical deformability as an inherent cell marker for testing malignant transformation and metastatic competence

Jochen Guck et al. Biophys J. 2005 May.

Abstract

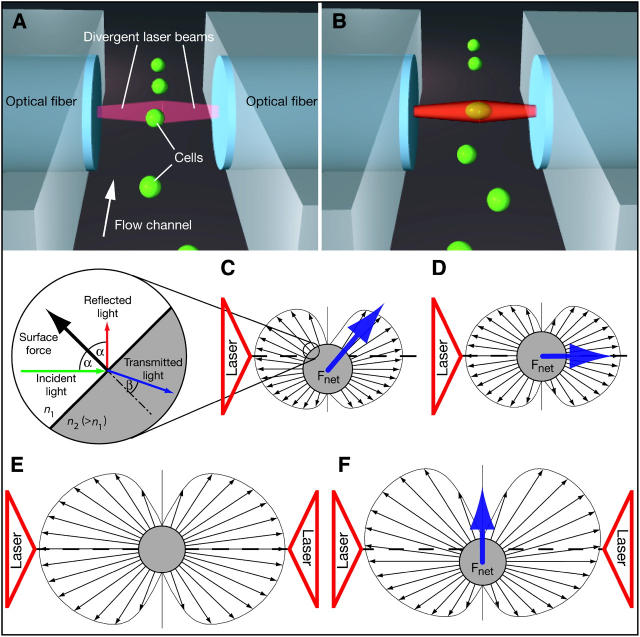
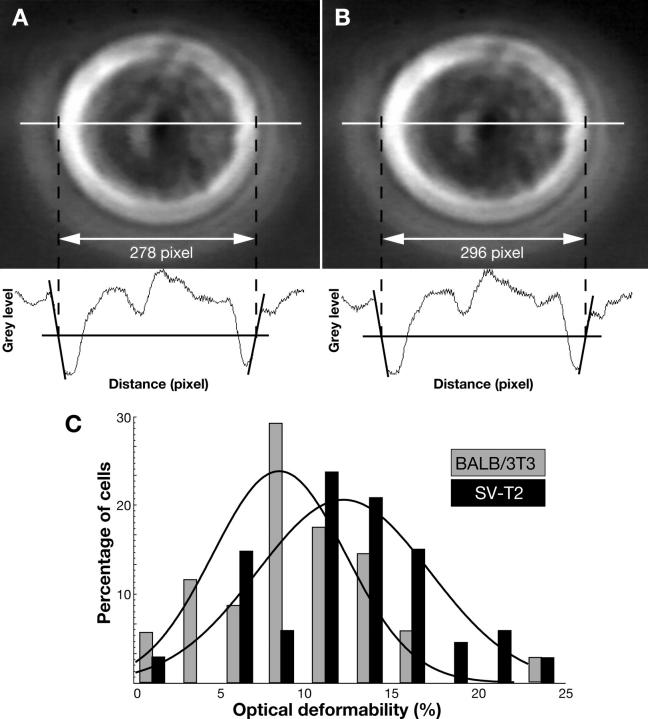
The relationship between the mechanical properties of cells and their molecular architecture has been the focus of extensive research for decades. The cytoskeleton, an internal polymer network, in particular determines a cell's mechanical strength and morphology. This cytoskeleton evolves during the normal differentiation of cells, is involved in many cellular functions, and is characteristically altered in many diseases, including cancer. Here we examine this hypothesized link between function and elasticity, enabling the distinction between different cells, by using a microfluidic optical stretcher, a two-beam laser trap optimized to serially deform single suspended cells by optically induced surface forces. In contrast to previous cell elasticity measurement techniques, statistically relevant numbers of single cells can be measured in rapid succession through microfluidic delivery, without any modification or contact. We find that optical deformability is sensitive enough to monitor the subtle changes during the progression of mouse fibroblasts and human breast epithelial cells from normal to cancerous and even metastatic state. The surprisingly low numbers of cells required for this distinction reflect the tight regulation of the cytoskeleton by the cell. This suggests using optical deformability as an inherent cell marker for basic cell biological investigation and diagnosis of disease.


Figures

FIGURE 1
FIGURE 1
Optically induced surface forces lead to trapping and stretching of cells. Cells flowing through a microfluidic channel can be serially trapped (A) and deformed (B) with two counterpropagating divergent laser beams (an animation can be found as supplementary material online). The distribution of surface forces (small arrows) induced by one laser beam with Gaussian intensity profile incident from the left (indicated with large triangles) for a cell that is (C) slightly below the laser axis and (D) on axis. An integration of these forces over the entire surface results in the net force Fnet shown as large arrows. The corresponding distributions for two identical but counterpropagating laser beams are shown for a cell on axis (E). This is a stable trapping configuration. When the cell is displaced from the axis (C and F), the symmetry of the resulting force distribution is broken, giving the net force a restoring component perpendicular to the laser axis. The inset shows the momenta of the various light rays and the resulting force at the surface.
FIGURE 2
FIGURE 2
Deformation of fibroblasts in an optical stretcher. A BALB/3T3 fibroblast deforms by 6.48% ± 0.36% (measurement error) along the laser axis, as determined by image analysis, when the light power is increased from 0.1 W (A) to 1.7 W (B) in both beams. Measuring large numbers of cells (C) reveals that the optical deformability of malignantly transformed SV-T2 fibroblasts is significantly shifted to higher values compared to normal BALB/3T3 fibroblasts (ODBALB/3T3 = 8.4 ± 1.0; ODSV-T2 = 11.7 ± 1.1; mean and mean ± SE). The scale bars are 10 μm.
FIGURE 3
FIGURE 3
Refractive index of fibroblasts. (A) Fit of an error function to the percentages of bright and dark cells compared to the surrounding medium as a function of refractive index of the medium, nmedium. Shown are the data for BALB/3T3 fibroblasts. (B) Resulting distributions of refractive indices, ncell, for BALB/3T3 (dashed line) and SV-T2 fibroblasts (solid line).
FIGURE 4
FIGURE 4
Cytoskeleton in suspended fibroblasts. Fluorescence confocal images clearly show the actin (red) and the microtubule network (green) in normal BALB/3T3 (A and C) and malignantly transformed SV-T2 (B) fibroblasts. The shadows within the cells coincide with the nucleus as checked with a nuclear stain (not included in the image). The scale bars are 10 μm.
FIGURE 5
FIGURE 5
F-actin in normal and malignant fibroblasts. The distributions of integrated Alexa-532 fluorescence intensity, which corresponds to the total amount of F-actin in BALB/3T3 (crosses) and SV-T2 fibroblasts (circles), was measured by LSC and fitted to log-normal distributions. The inset shows the distributions of total F-actin amount per cell divided by projected cell area.
FIGURE 6
FIGURE 6
Typical examples of the stretching of breast epithelial cells. The images in the left column are taken at an incident light power of 100 mW in each beam, which is sufficient for the trapping of the cells. At an incident light power of 600 mW (right column), the cancerous MCF-7 cells (C and D) deform more than the nonmalignant MCF-10 cells (A and B). The metastatic modMCF-7 cells (E and F) deform the most. The scale bar is 10 μm.
FIGURE 7
FIGURE 7
Optical deformability of normal, cancerous, and metastatic breast epithelial cells. (A) The three populations of the MCF cell lines and (B) the two populations of the MDA-MB-231 cell lines are clearly distinguishable in the histograms of the measured optical deformability (ODMCF-10 = 10.5 ± 0.8; ODMCF-7 = 21.4 ± 1.1; ODmodMCF-7 = 30.4 ± 1.8; ODMDA-MB-231 = 33.7 ± 1.4; ODmodMDA-MB-231 = 24.4 ± 2.5; mean and mean ± SE). The values were measured at t = 60 s.

Similar articles

Cited by

References

    1. Aaronson, S. A., and G. J. Todaro. 1968a. Basis for the acquisition of malignant potential by mouse cells cultivated in vitro. Science. 162:1024–1026. - PubMed
    1. Aaronson, S. A., and G. J. Todaro. 1968b. Development of 3T3-like lines from Balb-c mouse embryo cultures: transformation susceptibility to SV40. J. Cell. Physiol. 72:141–148. - PubMed
    1. Ashkin, A. 1970. Acceleration and trapping of particles by radiation pressure. Phys. Rev. Lett. 24:156–159.
    1. Ashkin, A., and J. M. Dziedzic. 1973. Radiation pressure on a free liquid surface. Phys. Rev. Lett. 30:139–142.
    1. Barer, R., and S. Joseph. 1954. Refractometry of living cells, Part I. Basic principles. Q. J. Microsc. Sci. 95:399–423.

Publication types

MeSH terms

LinkOut - more resources