Comparative Study
. 2005 Mar;17(3):903-14.
doi: 10.1105/tpc.104.029660. Epub 2005 Feb 18.

Comparisons of maize pericarp color1 alleles reveal paralogous gene recombination and an organ-specific enhancer region

Affiliations
Comparative Study

Comparisons of maize pericarp color1 alleles reveal paralogous gene recombination and an organ-specific enhancer region

Feng Zhang et al. Plant Cell. 2005 Mar.

Abstract

The maize (Zea mays) p1 (for pericarp color1) gene encodes an R2R3 Myb-like transcription factor that regulates the flavonoid biosynthetic pathway in floral organs, most notably kernel pericarp and cob. Alleles of the p1 gene condition distinct tissue-specific pigmentation patterns; to elucidate the molecular basis of these allele-specific expression patterns, we characterized two novel P1-rw (for red pericarp/white cob) alleles, P1-rw1077 and P1-rw751Ac. Structural analysis of P1-rw1077 indicated that this allele was generated by recombination between p1 and the tightly linked paralogous gene, p2. In the resulting gene, the p1 coding sequence was replaced by the p2 coding sequence, whereas the flanking p1 regulatory sequences remained largely preserved. The red pericarp color specified by P1-rw1077 suggests that the p1- and p2-encoded proteins are functionally equivalent as regulatory factors in the flavonoid biosynthesis pathway. Sequence analysis shows that the P1-rw1077 allele lacks a 386-bp sequence in a distal enhancer region 5 kb upstream of the transcription start site. An independently derived P1-rw allele contains an Ac insertion into the same sequence, indicating that this site likely contains cob glume-specific regulatory elements.


Figures

Figure 1.
Figure 1.
Distinct Phlobaphene Pigmentation Patterns of Different p1 Alleles. (A) Mature ear pigmentation patterns specified by the p1 alleles P1-rr4B2, P1-wr, P1-rw1077, and p1-ww1112 (from left to right). All alleles are homozygous in the 4Co63 background. (B) Ear pigmentation patterns of P1-rr4B2 and P1-rw1077 alleles at 16 and 28 DAP.
Figure 2.
Figure 2.
Accumulation of p1 Transcripts in P1-rw1077 and P1-rr4B2 during Development. (A) RNA gel blot analysis of p1 transcripts of P1-rw1077, P1-rr4B2, and p1-ww1112 at different developmental stages. Samples were taken from whole ears (0 DAP), developing kernels and cob (2 to 6 DAP), whole kernel (8 DAP), and kernel pericarp (12 to 21 DAP). Ten micrograms of total RNA was loaded in each lane. Hybridization probes are indicated at right. The actin cDNA probe was used as a loading control. (B) Quantified RNA levels of p1 and a1 from the RNA gel blot in (A) are normalized to actin to calculate relative transcript levels (y axis).
Figure 3.
Figure 3.
RT-PCR Analyses of p1 Transcripts in Kernel Pericarp and Cob Glumes. Nested RT-PCR was performed on total RNA extracted from pericarp and cob glumes of P1-rr4B2 and P1-rw1077 at 16 DAP. The top panel shows ethidium bromide–stained PCR products (570 bp) amplified with p1-specific primers (EP5-8-1 and ZFRT-8). The middle panel shows the results after blotting of the agarose gel and hybridization with the p1-specific probe. The bottom panel shows the same samples amplified with α-tubulin–specific primers as positive controls.
Figure 4.
Figure 4.
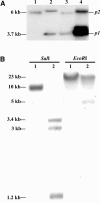
Genomic DNA Gel Blot Analyses of Different p1 Alleles. (A) Genomic DNAs of individual p1 alleles were digested with XbaI and hybridized with p1 fragment 8B (Figure 5). The p1-ww1112 (lane 1) allele contains only the 6-kb p2 band, whereas P1-rw1077 (lane 2), P1-rr4B2 (lane 3), and P1-wr (lane 4) alleles contain both the 3.7-kb p1 band and the 6-kb p2 band. In P1-wr, the high-intensity p1 band results from the tandem repeat of p1 sequence (Chopra et al., 1998). (B) Genomic DNAs of P1-rw1077 (lane 1) and P1-rr4B2 (lane 2) were digested with SalI and EcoRI and probed with p1 fragment 15 (Figure 5). Several restriction fragment length polymorphisms are apparent.
Figure 5.
Figure 5.
Gene Structure Comparisons of P1-rr4B2, P1-rw1077, and p2. The open boxes with black arrows indicate long direct repeats in the flanking regions of P1-rr4B2 and P1-rw1077. The black boxes connected by thin lines represent exon regions transcribed in P1-rr4B2, P1-rw1077, and p2 (in P1-rr4B2, only the major spliced product is shown). The bent arrow indicates the transcription start site in P1-rr4B2 (Grotewold et al., 1991). The hatched boxes represent 5′ UTRs and 90-bp promoter regions conserved among p1 alleles and the p2 gene (Zhang et al., 2000). The positions of 5′ and 3′ break points in the P1-rw1077 chimeric structure are indicated by offset lines. Sequences sharing homology with fragments 15 and 8B are indicated by the numbered open boxes. The boxes labeled Ji in both the P1-rw1077 allele and the p2 gene indicate the Ji-1 retrotransposon sequence (SanMiguel et al., 1996), previously reported as Prem-2 retrotransposon (Zhang et al., 2000). In P1-rw1077, the black box after the Ji sequence represents a truncated p1 exon 3 region. The white box upstream of the p2 promoter indicates the 500-bp sequence homologous with retroelement Prem-2. Triangles indicate the 80-bp, 734-bp, and 1.6-kb insertions in P1-rr4B2; the 80-bp insertion is also present in P1-rw1077 (Sidorenko et al., 2000; Zhang et al., 2000). The polymorphic distal enhancer regions in P1-rr4B2 and P1-rw1077 are located between the upstream SacI sites (dashed line) and downstream SalI sites (solid lines). The regions marked 15* indicate the partial fragment 15 sequences in P1-rw1077, which contain only the first 200 bp of the fragment 15 sequences. The gray bar between the PstI and SacI sites in P1-rr4B2 represents the 386-bp sequence, which is absent from the distal enhancer of P1-rw1077. The thin lines below P1-rw1077 indicate two overlapping P1-rw1077 genomic λ clones. Restriction sites are as follows: E, EcoRI; S, SacI; Sl, SalI. Not all restriction sites are indicated. The black arrowheads indicate primers that were used to isolate the 5′ and 3′ ends of P1-rw1077 transcripts: 1, EP5-8; 2, ZFRT-8; 3, EP5-16; 4, AP. The GenBank accession number of P1-rw1077 is AY702552.
Figure 6.
Figure 6.
Localization of p1 and p2 Recombination Break Points in P1-rw1077. (A) The 5′ region of P1-rw1077 was aligned with P1-rr4B2, P1-wr, and p2. The sequence in boldface indicates the exon 1 open reading frame, and the first base of the start codon is indicated as position +1. The triangle at position −8 in the 5′ UTR represents an 80-bp sequence that is present in p1 alleles but absent from p2 (Zhang et al., 2000). The arrows at +60 and +138 indicate nucleotide polymorphisms in P1-rw1077 that match the p2 sequence. Thus, the 5′ break point of p2-p1 crossover lies between the 80-bp insertion at −8 bp and the polymorphism at +60 bp. (B) The 3′ region of P1-rw1077 was aligned with p1 and p2 sequences. The exon 3 regions and Ji-homologous sequences in p1 and p2 are shown as in Figure 5. The 4-bp microhomology sequence CGCC at the break point is underlined.
Figure 7.
Figure 7.
Alignment of the Distal Enhancer Region in P1-rr4B2 and P1-rw1077. DNA sequences of P1-rr4B2 and P1-rw1077 were aligned at the distal enhancer region (between the two SacI sites shown in Figure 5). Restriction sites are shaded; the sequence between the first SacI site and the SalI site corresponds to fragment 15, whereas the sequence after the second SacI site corresponds to fragment 14. The dashed lines represent gaps in the alignment. The black bar above the P1-rr4B2 sequence indicates the 386-bp region that is replaced by a 54-bp sequence in P1-rw1077. The gray arrowhead represents the 1.6-kb transposon-like sequence present in P1-rr4B2, and the black arrowhead represents the Ac element in the P1-rw512A2Ac and P1-rw751Ac alleles. The 8-bp underlined sequence indicates the target site duplicated upon transposon insertion. The boxed sequences are three putative ACGT motifs, designated I, II, and III, and the putative RY element.
Figure 8.
Figure 8.
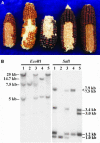
Phenotypes and DNA Gel Blot Analysis of P1-rw512A2Ac and P1-rw751Ac. (A) Phenotypic comparisons of P1-ovov1114, P1-rw512A2Ac, P1-rw751Ac4, P1-rw751Ac5, and P1-rr4B2 alleles (from left to right). All alleles are homozygous except for P1-rw512A2Ac, which is heterozygous with p1-ww [4Co63]. (B) Genomic DNA gel blot analysis of P1-rw751Ac4 (lane 1), p1-ww [4Co63] (lane 2), P1-rw751Ac5 (lane 3), P1-rw512A2Ac (lane 4), and P1-rr4B2 (lane 5). DNA samples were digested with EcoRI and SalI and probed with p1 fragment 15. The P1-rw751Ac4 and P1-rw751Ac5 alleles are heterozygous with p1-ww [4Co63], whereas the P1-rw512A2Ac allele is homozygous.
Figure 9.
Figure 9.
Gene Structures of P1-rr4B2, P1-rw512A2Ac, and P1-rw751Ac Alleles. The bent arrow indicates the p1 transcription start site. The black boxes with connected lines represent the exon/intron structure of the major P1-rr4B2 splicing product (Grotewold et al., 1991). The open box indicates the 1.6-kb transposon-like sequence inserted into the farthest 5′ copy of fragment 15 in the P1-rr4B2 allele (Figure 5). The triangles with arrows represent Ac transposable elements, and the black arrows indicate the orientations of Ac (from 5′ to 3′). The gray boxes represent sequence homology with fragment 15. The black arrowheads with numbers indicate primers that were used to determine Ac insertion sites: 1, iAc3-2; 2, Ac-123; 3, ZFPrr-4; 4, EP3-7; 5, PA-A13; 6, PP1′. Restriction sites are as follows: E, EcoRI; S, SalI; S*, methylated SalI. The drawing is not to scale.

Similar articles

Cited by

References

    1. Anderson, E.G. (1924). Pericarp studies in maize. II. The allelomorphism of a series of factors for pericarp color. Genetics 9, 442–453. - PMC - PubMed
    1. Athma, P., and Peterson, T. (1991). Ac induces homologous recombination at the maize P locus. Genetics 128, 163–173. - PMC - PubMed
    1. Athma, P., Grotewold, E., and Peterson, T. (1992). Insertional mutagenesis of the maize P gene by intragenic transposition of Ac. Genetics 131, 199–209. - PMC - PubMed
    1. Barkan, A., and Martienssen, R. (1991). Inactivation of maize transposon Mu suppresses a mutant phenotype by activating an outward-reading promoter near the end of Mu1. Proc. Natl. Acad. Sci. USA 88, 3502–3506. - PMC - PubMed
    1. Belmaaza, A., and Chartrand, P. (1994). One-sided invasion events in homologous recombination at double-strand breaks. Mutat. Res. 314, 199–208. - PubMed

Publication types

Associated data

LinkOut - more resources