. 2005 Mar;6(3):256-61.
doi: 10.1038/sj.embor.7400356.

Resetting of peripheral circadian clock by prostaglandin E2

Affiliations

Resetting of peripheral circadian clock by prostaglandin E2

Yoshiki Tsuchiya et al. EMBO Rep. 2005 Mar.

Abstract

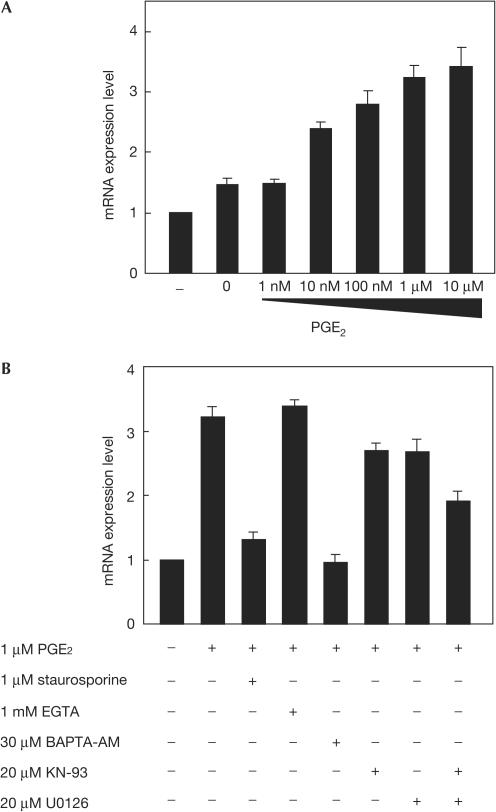
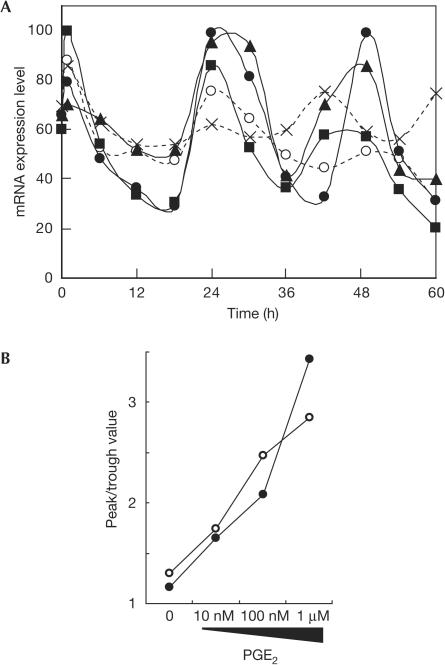
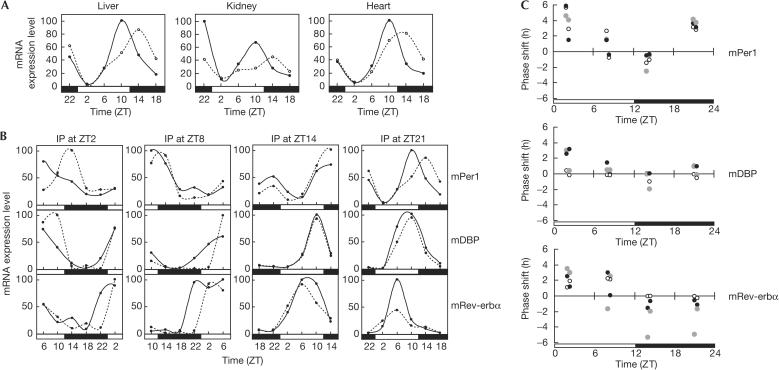
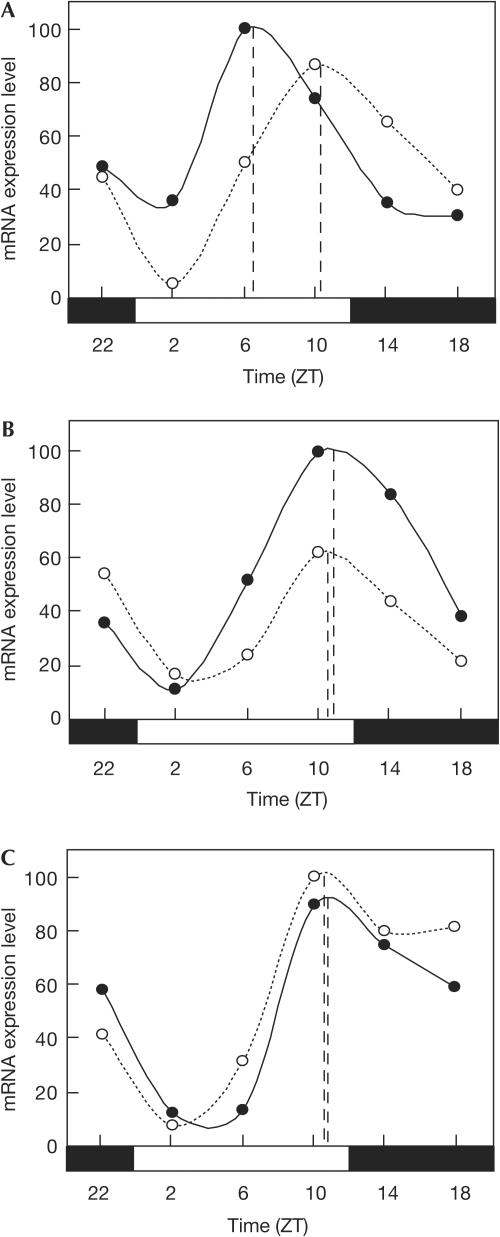
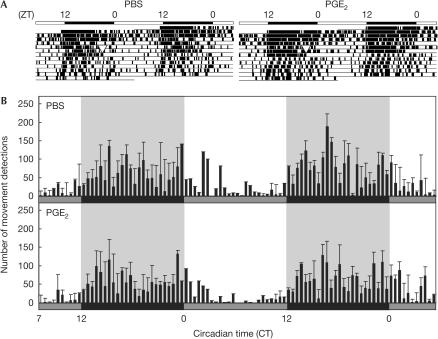
In mammals, the master circadian pacemaker is located in the suprachiasmatic nucleus (SCN) of the hypothalamus. The SCN is thought to drive peripheral oscillators by controlling neuronal and humoral signals that can entrain the peripheral clocks. Here, we show that prostaglandin E2 (PGE2), a proinflammatory compound known to have diverse biological effects, is able to act as an in vivo clock-resetting agent. We find that in cultured NIH3T3 fibroblasts, PGE2 is able to induce transient expression of Period 1 messenger RNA and the following circadian oscillation of clock gene expression. Furthermore, we demonstrate that intraperitoneal administration of PGE2 results in the phase shift of circadian gene expression in mouse peripheral tissues in a time-dependent manner. This phase shift is also induced by the EP1/EP3 agonist sulprostone but not by the EP2 agonist butaprost. The PGE2-induced phase shift is inhibited by the EP1 antagonist SC-51322. These results suggest that PGE2 acts as an in vivo clock-resetting factor by means of the EP1 subtype of PGE receptors.


Figures

Figure 1
Figure 1
Induction of mPer1 mRNA expression by prostaglandin E2 (PGE2) in NIH3T3 cells. (A) Dose-dependent induction of mPer1 mRNA by PGE2 treatment of NIH3T3 cells. Relative levels of mRNA expression 1 h after the indicated treatment are evaluated by the real-time quantitative PCR method. Each value was normalized to mG3PDH. Values are mean±s.e.m. from three experiments. (B) Effect of inhibitors on mPer1 induction by PGE2 treatment. NIH3T3 cells are treated with the indicated agents 30 min before PGE2 treatment. Values are mean±s.e.m. from three experiments.
Figure 2
Figure 2
Circadian gene expression induced by prostaglandin E2 (PGE2) in NIH3T3 cells. (A) Circadian oscillation of the expression level of mPer2 mRNA induced by varying concentrations of PGE2. At time 0, NIH3T3 cells were treated with no stimulus (crosses), PBS (open circles) and 10 nM (squares), 100 nM (triangles) and 1 μM (filled circles) of PGE2, and the mRNA expression levels were monitored by the real-time quantitative PCR method. Each value was normalized to mG3PDH. Data shown are representative of three independent experiments. (B) Robustness of circadian gene expression induced by PGE2 in NIH3T3 cells. The peak and trough values of mRNA expression levels in the second cycle of oscillation were read from the graph and the extent of amplitude was plotted. Graphs shown are data for mPer2 (filled circles) and mDBP (open circles).
Figure 3
Figure 3
Phase shifts induced by prostaglandin E2 (PGE2) in mouse peripheral tissues. (A) Phase shifts of circadian rhythm of mPer1 mRNA expression in peripheral tissues by PGE2. Mice were entrained under a 12:12 light:dark cycle for 2 weeks and intraperitoneal administration of PGE2 dissolved in PBS (solid line), or PBS alone (dotted line) was performed at ZT21. Two mice (one PGE2 injected and the other PBS injected) were killed and mRNA was collected from tissues at each time point. The mRNA expression levels were evaluated by real-time quantitative PCR. Each value was normalized to mG3PDH. Data shown are representative of two independent experiments. (B) Variations of the phase shifts of circadian gene expression in liver induced by PGE2 at different time points. Intraperitoneal (i.p.) administration of PGE2 (solid line) and PBS (dotted line) was performed at different circadian time points. The mRNA expression levels of mPer1, mDBP and mRev-erbα were monitored. Data shown are representative of two independent experiments. (C) The amplitudes of phase shifts by PGE2 at each circadian time point (ZT2, ZT8, ZT14 and ZT21). The amplitudes of phase shifts of mPer1, mDBP and mRev-erbα were evaluated in liver (black circles), kidney (grey circles) and heart (open circles). Data from two independent experiments were plotted.
Figure 4
Figure 4
The EP1 receptor is responsible for the phase shifts by prostaglandin E2 (PGE2). (A) Intraperitoneal administration of sulprostone (solid line) or PBS alone (dotted line) was performed at ZT21. mRNA was collected from liver at each time point and the expression levels of mPer1 mRNA were evaluated by real-time quantitative PCR. Each value of mRNA expression levels was normalized to mG3PDH. Data shown are representative of two independent experiments. (B) Intraperitoneal administration of butaprost (solid line) or PBS alone (dotted line) was performed at ZT21. The expression levels of mPer1 mRNA in liver were monitored as in (A). (C) Intraperitoneal administration of PGE2 together with SC-51322 (solid line), or PBS alone (dotted line) was performed at ZT21. The expression levels of mPer1 mRNA in liver were monitored as in (A).
Figure 5
Figure 5
Prostaglandin E2 (PGE2) induces no significant alteration in circadian locomotor activity. (A) Representative double-plotted actograms show locomotor activity records of PBS alone (left) or PGE2-injected (right) mouse at ZT21 (arrowheads). Mice were housed in a light–dark cycle for a week and injected with PBS or PGE2 intraperitoneally at ZT21. Then, mice were maintained in constant darkness. (B) Activity profile over 2 days from 10 h after intraperitoneal injection of PBS or PGE2 at ZT21. Bars represent mean (±s.e.m., n=4) summed number of movement detections during 30 min of recording. Grey and black bars represent the subjective day and night, respectively. Shaded background also represents the subjective night. CT0 corresponds to ZT0 in constant dark conditions.

References

    1. Akashi M, Nishida E (2000) Involvement of the MAP kinase cascade in resetting of the mammalian circadian clock. Genes Dev 14: 645–649 - PMC - PubMed
    1. Balsalobre A, Damiola F, Schibler U (1998) A serum shock induces circadian gene expression in mammalian tissue culture cells. Cell 93: 929–937 - PubMed
    1. Balsalobre A, Marcacci L, Schibler U (2000a) Multiple signaling pathways elicit circadian gene expression in cultured Rat-1 fibroblasts. Curr Biol 10: 1291–1294 - PubMed
    1. Balsalobre A, Brown SA, Marcacci L, Tronche F, Kellendonk C, Reichardt HM, Schutz G, Schibler U (2000b) Resetting of circadian time in peripheral tissues by glucocorticoid signaling. Science 289: 2344–2347 - PubMed
    1. Bos CL, Richel DJ, Ritsema T, Peppelenbosch MP, Versteeg HH (2004) Prostanoids and prostanoid receptors in signal transduction. Int J Biochem Cell Biol 36: 1187–1205 - PubMed

Publication types

LinkOut - more resources