

Correlation of radiographic and MRI parameters to morphological and biochemical assessment of intervertebral disc degeneration
- PMID: 15723249
- PMCID: PMC3476685
- DOI: 10.1007/s00586-004-0759-4
Correlation of radiographic and MRI parameters to morphological and biochemical assessment of intervertebral disc degeneration
Abstract
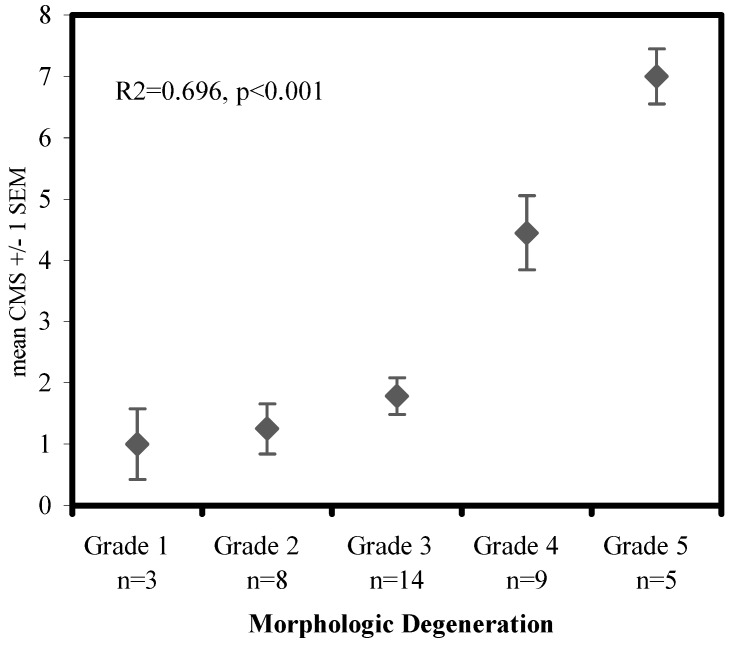
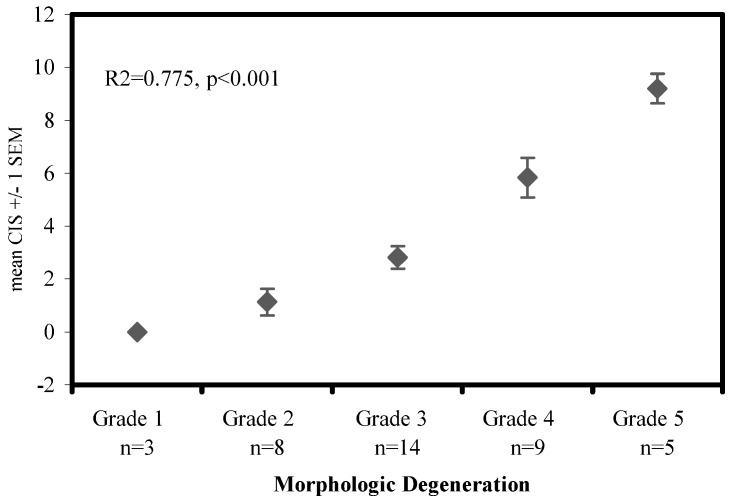
Degenerative disc disease (DDD) is a common finding in MRI scans and X-rays. However, their correlation to morphological and biochemical changes is not well established. In this study, radiological and MRI parameters of DDD were assessed and compared with morphological and biochemical findings of disc degeneration. Thirty-nine human lumbar discs (L1-S1), age 19-86 years, were harvested from eight cadavers. Within 48 h postmortem, MRIs in various spin-echo sequences and biplanar radiographs of intact spines were obtained. Individual discs with endplates were then sectioned in the mid-sagittal plane and graded according to the morphological appearance. Samples from the nucleus of each disc were harvested for biochemical analysis including water and proteoglycan contents. On MRIs, T2-signal intensity, Modic changes, disc extension beyond the interspace (DEBIT), nucleus pulposus shape, annular tears, osteophytes and endplate integrity were graded. On radiographs, an independent observer classified the parameters disc height, endplate sclerosis, osteophytes, Schmorl's nodes, intradiscal calcifications and endplate shape. General linear-regression models were used for statistical analysis. Backward elimination with a 10% significance cut-off level was used to identify the most significant parameters, which then were summed to create composite scores for radiography, MRI and the combination of both methods. The grading was performed by three observers, and a reliability analysis using Cronbach's alpha model was used to control interobserver agreement. The three radiographic parameters height-loss, osteophytes and intradiscal calcifications correlated significantly with the morphological degree of degeneration (p<0.001, R2=642). Significant differences of even one morphological grade could also be differentiated in the composite radiological score (p<0.05), except at the extremes between grades 1 and 2 and grades 4 and 5. All MRI parameters correlated significantly with the morphological grade (p<0.05); however Modic changes, T2-intensity and osteophytes accounted for 83% of the variation in the data. T2-signal intensity correlated significantly with H2O and proteoglycan content (p<0.001), and was best for detecting highly degenerated discs. Regression showed that the combined score was better correlated with the morphological grade (p<0.001, R2=775) than either the composite radiographic (p<0.001, R2=642) or composite MRI (p<0.001, R2=696) alone. Based on the combined score, a backwards elimination of the regression was performed, in which the parameters Modic changes, and T2-intensity loss (MRI) as well as calcifications (X-ray) accounted for 87% of the variability. The interobserver validation showed a high correlation for all three scores (Cronbach's alpha values ranging from 0.95 to 0.97).
Conclusion: Selective imaging parameters and a newly created scoring scheme were found to correlate with disc degeneration as determined in a morphological manner. Surprisingly, radiographic parameters were able to distinguish different stages of degeneration, whereas MRI could only detect advanced stages of disc degeneration. We conclude that X-rays may remain a cost-effective, non-invasive in vivo-grading method to detect early disc degeneration, and, combined with MRI, correlate best with morphological and biochemical assessment of disc degeneration.
Figures


References
Publication types
MeSH terms
Substances
LinkOut - more resources
Full Text Sources
Medical
Research Materials
