

doi: 10.1084/jem.20050197.
Movies, measurement, and modeling: the three Ms of mechanistic immunology
Affiliations
- PMID: 15728232
- PMCID: PMC2213049
- DOI: 10.1084/jem.20050197
Item in Clipboard
Movies, measurement, and modeling: the three Ms of mechanistic immunology
J Exp Med.
.
Abstract
Immunological phenomena that were once deduced from genetic, biochemical, and in situ approaches are now being witnessed in living color, in three dimensions, and in real time. The information in time-lapse imaging can provide valuable mechanistic insight into a host of processes, from cell migration to signal transduction. What we need now are methods to quantitate these new visual data and to exploit computational resources and statistical mechanical methods to develop mechanistic models.
Figures

Tracking cell migration in four dimensions. A still photo taken from a time-lapse video of GFP-labeled thymocytes moving in three dimensions through an intact thymic lobe acquired by TPLSM. The image (left) was reconstructed from a single z stack and is shown along the x and y axes with selected migratory tracks highlighted. Tracks were generated using Imaris computer software by Bitplane, and are color coded to indicate the passage of time from blue (beginning of imaging) to yellow (end of imaging). The volumes of tracked cells have been hidden to better show the tracks. The x, y, and z coordinates of the tracked object are determined at each time point throughout tracking. Coordinate data is then imported into Microsoft Excel and can be used to extract a number of measurements related to three-dimensional movement. (Right) The same image has been rotated along the z axis. All cell volumes have been hidden.
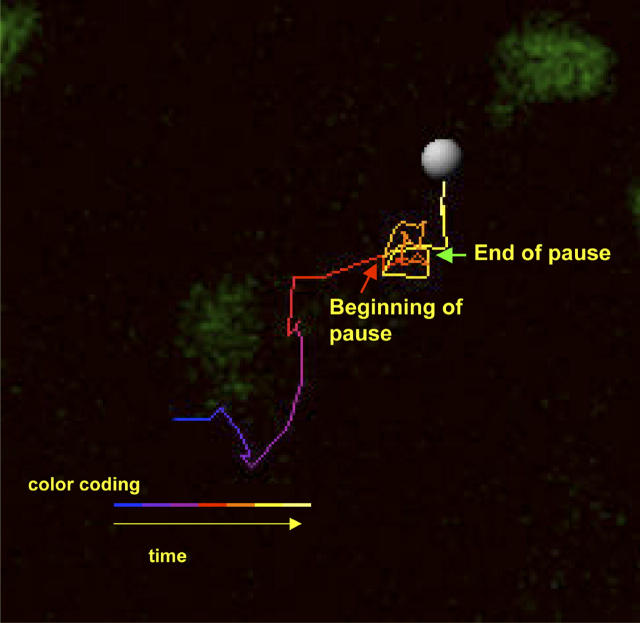
Quantitating migratory pausing. A still photo taken from time-lapse video acquired by TPLSM shows the migratory path taken by a single GFP-labeled thymocyte as it moved through an intact thymic lobe. The red arrow indicates the point at which cell displacement ceased and the green arrow indicates the time at which the cell resumed its displacement. This behavior can be measured to determine the incidence and the average duration of pausing calculated from thousands of migratory events (unpublished data).
References
-
- Miller, M.J., S.H. Wei, I. Parker, and M.D. Cahalan. 2002. Two-photon imaging of lymphocyte motility and antigen response in intact lymph node. Science. 296:1869–1873. - PubMed
-
- Stoll, S., J. Delon, T.M. Brotz, and R.N. Germain. 2002. Dynamic imaging of T cell- dendritic cell interactions in lymph nodes. Science. 296:1873–1876. - PubMed
-
- Bousso, P., N.R. Bhakta, R.S. Lewis, and E. Robey. 2002. Dynamics of thymocyte-stromal cell interactions visualized by two-photon microscopy. Science. 296:1876–1880. - PubMed
-
- Mempel, T.H., S.E. Henrickson, and U.H. von Andrian. 2004. T-cell priming by dendritic cells in lymph nodes ocurs in three distinct phases. Nature. 427:154–159. - PubMed
