. 2005 Feb 21;201(4):647-57.
doi: 10.1084/jem.20041611.

Clearance of apoptotic neurons without inflammation by microglial triggering receptor expressed on myeloid cells-2

Affiliations

Clearance of apoptotic neurons without inflammation by microglial triggering receptor expressed on myeloid cells-2

Kazuya Takahashi et al. J Exp Med. .

Abstract

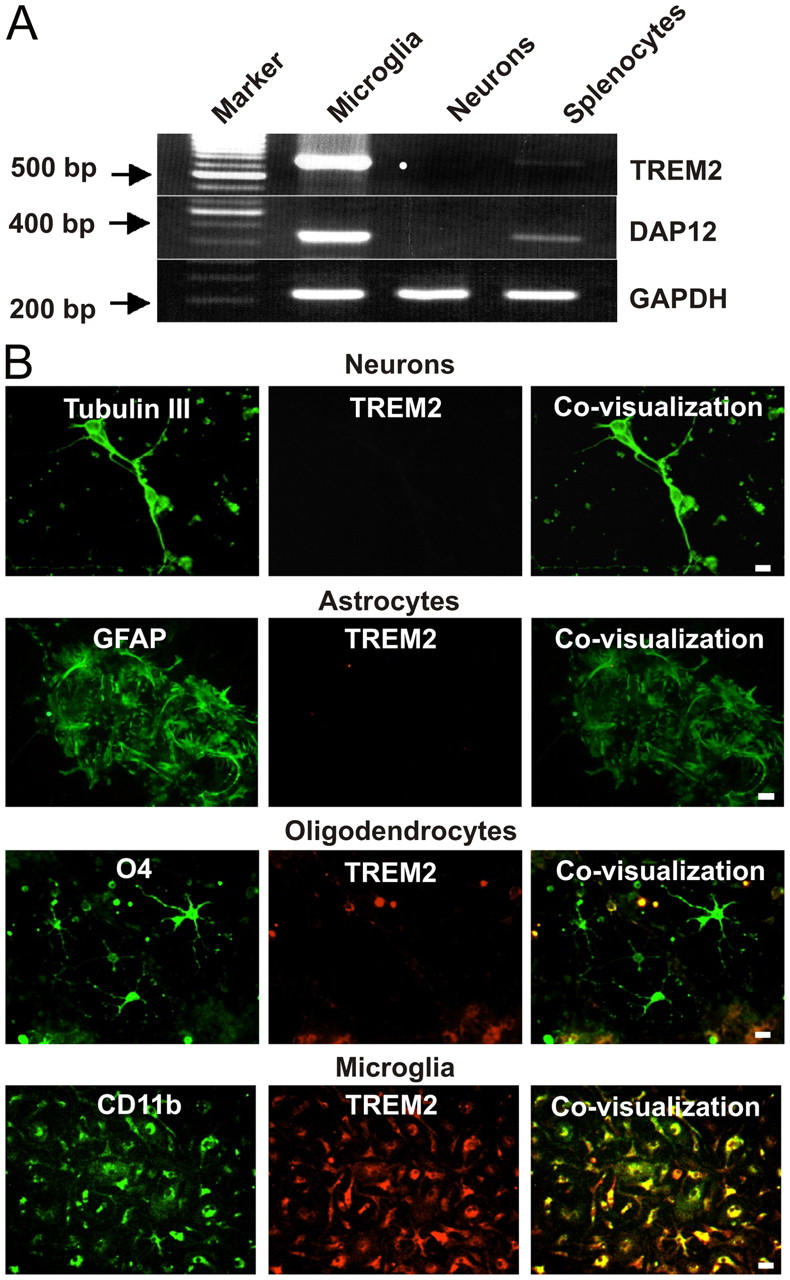
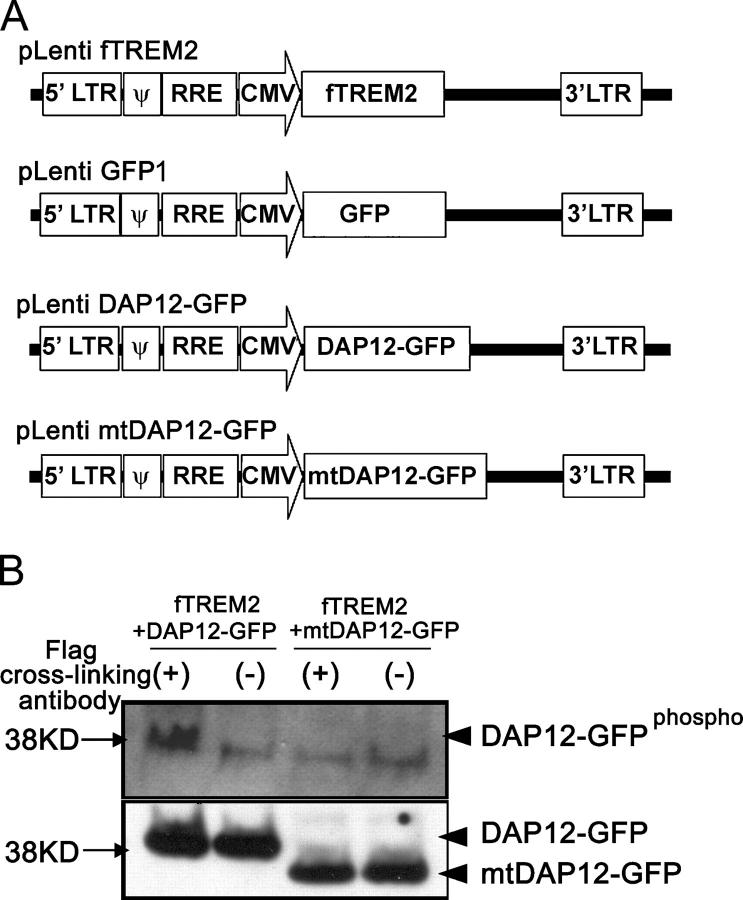
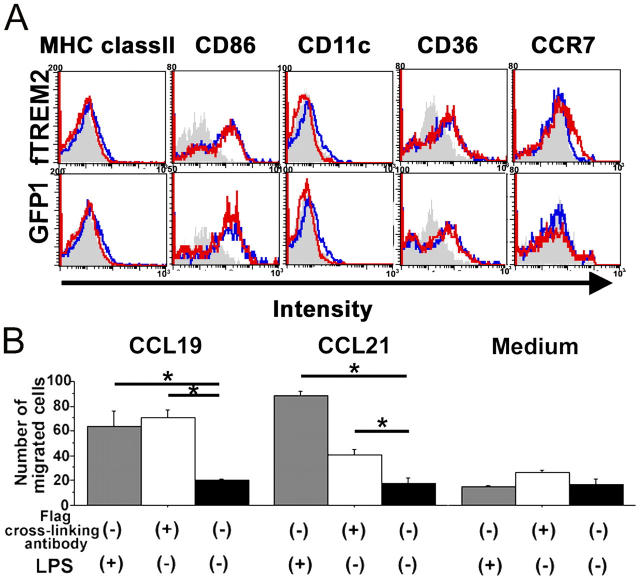
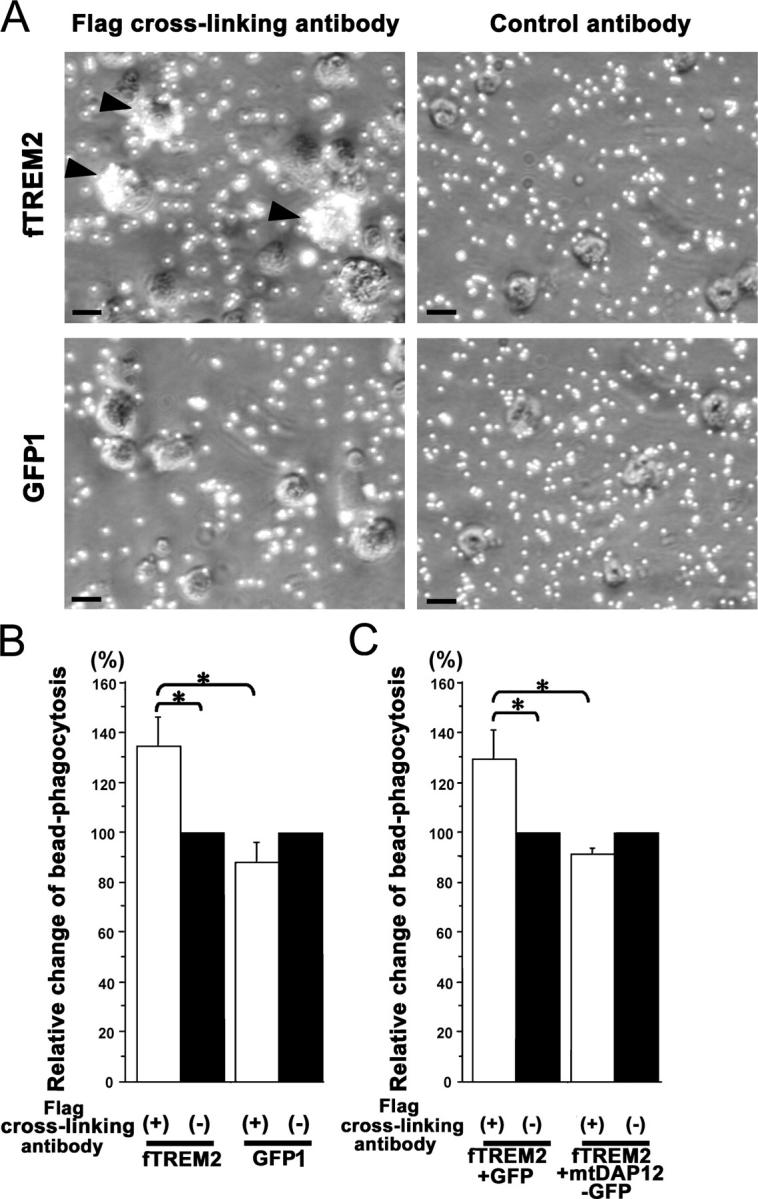
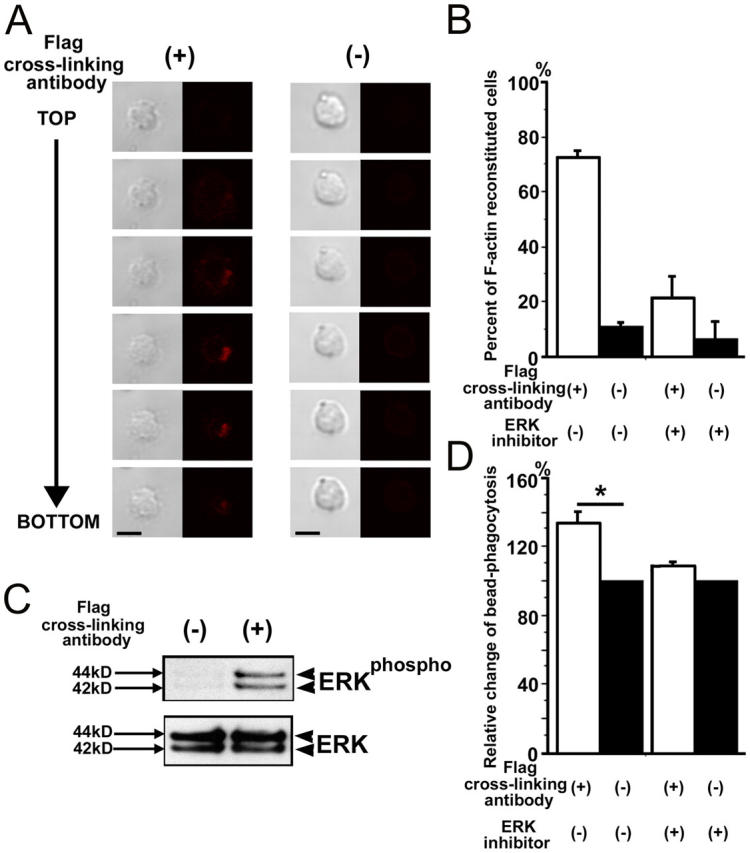
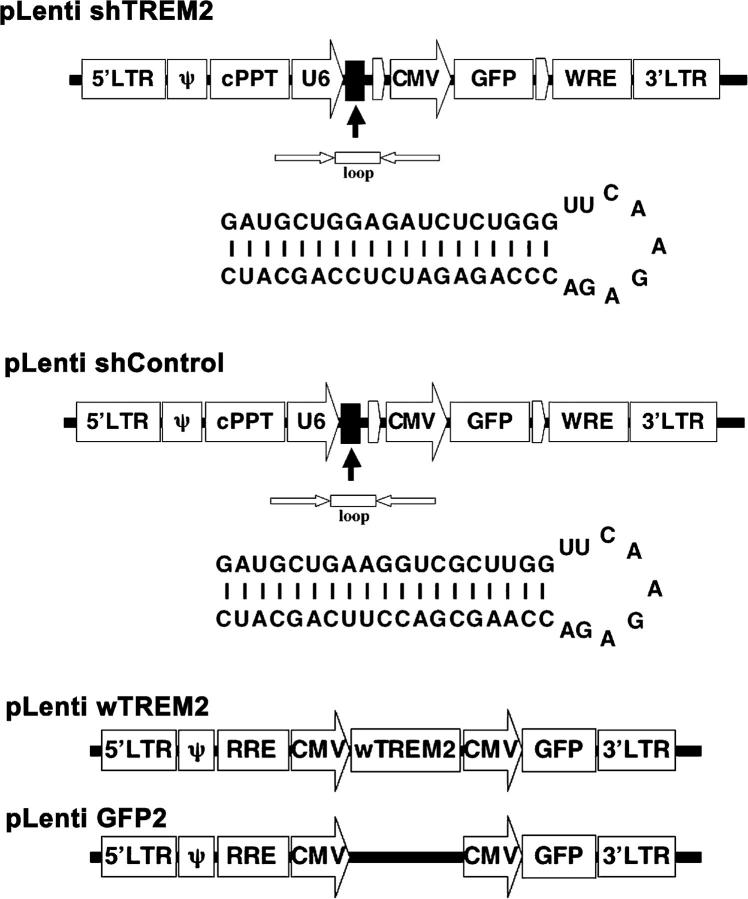
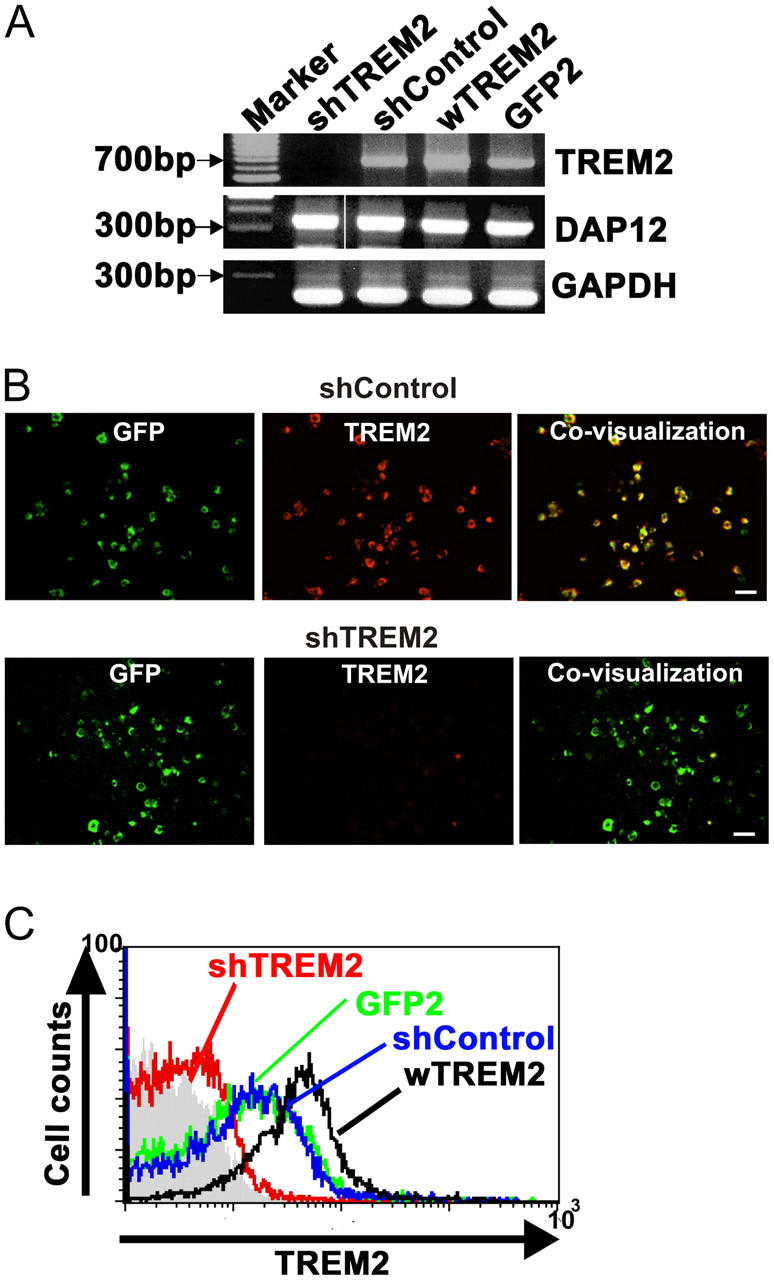
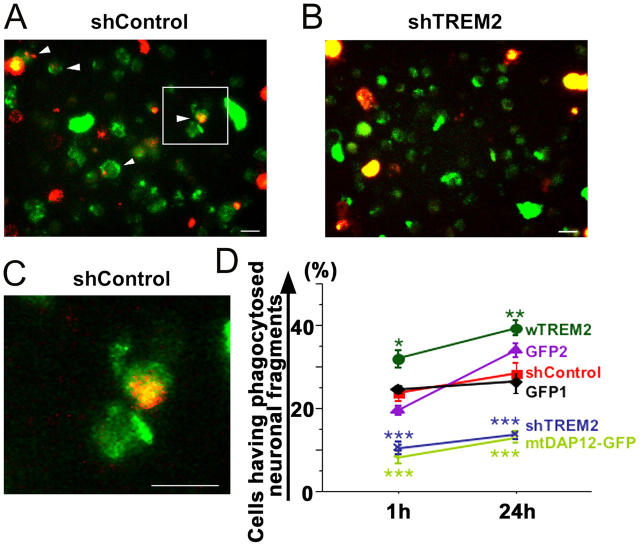
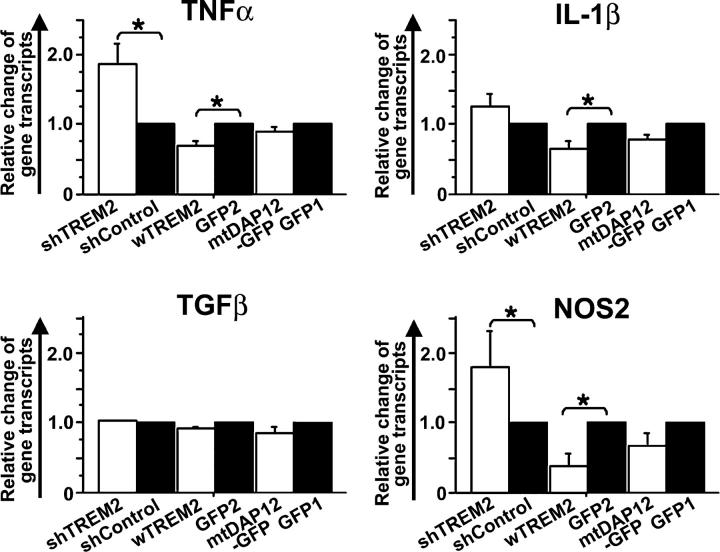
Elimination of apoptotic neurons without inflammation is crucial for brain tissue homeostasis, but the molecular mechanism has not been firmly established. Triggering receptor expressed on myeloid cells-2 (TREM2) is a recently identified innate immune receptor. Here, we show expression of TREM2 in microglia. TREM2 stimulation induced DAP12 phosphorylation, extracellular signal-regulated kinase phosphorylation, and cytoskeleton reorganization and increased phagocytosis. Knockdown of TREM2 in microglia inhibited phagocytosis of apoptotic neurons and increased gene transcription of tumor necrosis factor alpha and nitric oxide synthase-2, whereas overexpression of TREM2 increased phagocytosis and decreased microglial proinflammatory responses. Thus, TREM2 deficiency results in impaired clearance of apoptotic neurons and inflammation that might be responsible for the brain degeneration observed in patients with polycystic lipomembranous osteodysplasia with sclerosing leukoencephalopathy/Nasu-Hakola disease.


Figures

Figure 1.
Figure 1.
Gene transcription and protein expression of TREM2 in primary microglia. (A) RT-PCR for TREM2, DAP12, and GAPDH was performed from RNA of primary cultured microglia, neurons, and splenocytes. Gene transcripts of TREM2 and DAP12 were observed in microglia and weakly in splenocytes, but not in neurons. Molecular weight marker: 100-bp ladder. (B) Immunohistochemistry of cultured neurons, astrocytes, oligodendrocytes, and microglial cells. The distinct cell types were identified by specific antibodies (green fluorescence) directed against β tubulin–III, GFAP, O4, and CD11b. Cells were double labeled (red fluorescence) with specific polyclonal antibodies directed against TREM2. Expression of TREM2 was detected on 97.6 ± 2.4% (mean ± SEM) of microglial cells identified by double labeling with CD11b. No expression of TREM2 was detected on neurons, astrocytes, or oligodendrocytes. Bars, 10 μm.
Figure 2.
Figure 2.
Lentiviral vectors and phosphorylation of DAP12 after stimulation of TREM2. (A) Schematic drawing of lentiviral vectors for expression of fTREM2, GFP (GFP1), DAP12 tagged with GFP (DAP12-GFP), or mutant mtDAP12 tagged with GFP (mtDAP12-GFP). (B) Phosphorylated DAP12-GFP was detected after blotting with the antibody directed against tyrosine phosphate in fTREM2 plus DAP12-GFP–cotransfected cells and after cross-linking stimulation. DAP12-GFP or mtDAP12-GFP were detected after reblotting with the antibody directed against GFP in the samples, respectively.
Figure 3.
Figure 3.
TREM2 stimulation up-regulates CCR7 and increases migration of microglia toward CCL19 and CCL21. Primary murine microglia were transduced with fTREM2 or GFP control vector. Microglia were cultured on dishes coated with cross-linking antibody directed against the Flag epitope (+) or a control antibody (−). (A) Primary microglia were transduced with fTREM2 or GFP control vector and cultured on dishes coated with cross-linking antibody directed against the Flag epitope (red line) or control antibody (blue line) for 72 h. Cells were analyzed by flow cytometry after staining by specific antibodies directed against MHC class II, CD86, CD11c, CD36, and CCR7. Staining of cells with an isotype control antibody was performed (gray filled). A slight increase in CCR7 expression was observed in fTREM2-transduced microglia after stimulation of TREM2, which was not detected in the control vector–transduced microglia. (B) TREM2 stimulation directs migration of microglia toward the CCR7 ligands CCL19 and CCL21. fTREM2-transduced microglia stimulated for 24 h with precoated 10 μg/ml antibody directed against the Flag epitope (white bars), 10 μg/ml isotype control antibody (black bars), or LPS (gray bars) were tested in transwell chemotaxis assays for their ability to migrate toward medium alone or medium supplemented with CCL19 or CCL21. Microglia showed increased migration toward CCL19 and CCL21. *, P < 0.05; Mann-Whitney U test.
Figure 4.
Figure 4.
Increased bead phagocytosis after stimulation of TREM2. (A) Primary murine microglia were transduced either with fTREM2 vector (fTREM2) or GFP1 control vector. Microglia were cultured on dishes coated with antibodies directed against the Flag epitope to cross-link the fTREM2 or control antibodies. Microglia were stimulated with antibodies for 24 h. Microsphere beads were then added for 1 h. Phase contrast images are shown, demonstrating visible phagocytosis of microshpere beads after stimulation of fTREM2-transduced microglia by cross-linking antibodies. Bars, 10 μm. (B) Phagocytosis was quantified by flow cytometry. The relative change in bead phagocytosis after fTREM2 stimulation was compared with nonstimulated bead phagocytosis. Microglia transduced with fTREM2 showed a significant increase in bead phagocytosis after cross-link stimulation, whereas no significant change in bead phagocytosis was observed in GFP1-transduced microglia after cross-link stimulation. Data are presented as mean ± SEM of at least three independent experiments. *, P < 0.05; Mann-Whitney U test. (C) The relative change in bead phagocytosis after fTREM2 stimulation compared with the nonstimulated situation by flow cytometry. Microglia was transduced with fTREM2 plus GIPγ or fTREM2 plus mutant DAP12 (mtDAP12-GFP). The mtDAP12 transduction prevented the increase in bead phagocytosis after fTREM2 stimulation. Data are presented as mean ± SEM of at least three independent experiments. *, P < 0.01; Mann-Whitney U test.
Figure 5.
Figure 5.
Cytoskeleton reorganization and ERK signaling after stimulation of microglial phagocytosis by TREM2 cross-linking. (A) Primary murine microglia were transduced with fTREM2 vector. Microglia were cultured on dishes coated with antibodies directed against the Flag epitope (+) to cross-link the fTREM2 or control antibodies (−) for 1 h. Microglia were fixed and then stained with Alexa Fluor 546–conjugated phalloidin. Individual microglial cells were scanned by a confocal microscope from top (TOP) to bottom (BOTTOM) with a step of 1.6 μm between each optical section. Strong F-actin staining was observed at the bottom of the cells after TREM2 stimulation. Phase contrast and confocal images are shown. Bars, 10 μm. (B) Cytoskeleton reorganization of F-actin was quantified by counting the number of cells showing F-actin at the bottom of the cells. Data are presented as mean ± SEM. (C) Western blot analysis of protein lysates of primary microglial cells. Phosphorylated ERK was detected after blotting with a specific antibody directed against phosphorylated ERK in fTREM2-transfected cells after stimulation with a cross-linking antibody (+), but not the control antibody (−). The total protein amount of ERK was detected after reblotting with an antibody directed against total ERK. (D) Increased bead phagocytosis after fTREM2 stimulation is neutralized by ERK inhibitor. The relative change in bead phagocytosis after fTREM2 stimulation was compared between the stimulated (open bars) and nonstimulated (closed bars) situation by flow cytometry. Microglia were transduced with fTREM2 vector and treated with or without ERK inhibitor. ERK inhibitor reverted the increase of phagocytosis stimulated by TREM2. Data are presented as mean ± SEM of at least three independent experiments. *, P < 0.05; Mann-Whitney U test.
Figure 6.
Figure 6.
Schematic drawing of lentiviral vectors for knocking down TREM2 (shTREM2), shControl vector, wTREM2 vector, and GFP control vector (GFP2).
Figure 7.
Figure 7.
Knockdown and overexpression of TREM2 receptors in microglia by lentiviral vectors. (A) Gene transcript analysis of cultured microglia transduced with the shTREM2, shControl, wTREM2, or GFP2 vector. Gene transcripts for TREM2 and GAPDH were analyzed by RT-PCR. The lentiviral vector producing short hairpin RNAs specific for TREM2 induced complete knockdown of TREM2 gene transcripts. Gene transcripts for GAPDH and DAP12 served as an internal control and were not affected by the shTREM2 vector. Molecular weight marker: 100-bp ladder. (B) Protein expression of TREM2 was analyzed by a polyclonal antibody directed against TREM2 of cultured microglia transduced with the shTREM2 or shControl vector. Expression of TREM2 was not detectable by immunohistochemistry in microglia transduced with the shTREM2 vector. Bars, 20 μm. (C) Flow cytometry analysis of cultured microglial cells transduced either with a lentiviral vector producing short hairpin RNAs specific for TREM2 (shTREM2), irrelevant short hairpin RNAs (shControl), wTREM2, or control GFP (GFP2). shTREM2 transduction expression of TREM2 was almost undetectable, whereas wTREM2 transduction increased levels of TREM2 expression on microglia.
Figure 8.
Figure 8.
TREM2 expression of microglia determines phagocytosis of apoptotic neuronal membranes. Cultured neurons were labeled with a red fluorescent membrane dye, treated with okadaic acid to induce apoptosis, and cocultured with microglia transduced either with a lentiviral vector producing short hairpin RNAs specific for TREM2 (shTREM2), irrelevant short hairpin RNAs (shControl), wTREM2, control GFP2 vector, mtDAP12 (mtDAP12-GFP), or control GFP1 vector. Cells were analyzed by fluorescence microscopy and flow cytometry. (A) Microglia (green fluorescent protein) lentivirally transduced with the control vector (shControl) phagocytosed apoptotic neuronal membrane fragments (red fluorescent dye) as shown by confocal images. Inset as indicated. Bar, 10 μm. (B) No obvious phagocytosis was observed in TREM2 knockdown microglia. Bar, 10 μm. (C) High magnification of the shControl image. Bar, 10 μm. (D) The percentage of cells having phagocytosed apoptotic neuronal membrane fragments was quantified by flow cytometry at 1 and 24 h of coculture. Microglia were transduced with lentiviral vectors producing short hairpin RNAs specific for TREM2 (shTREM2), irrelevant short hairpin RNAs (shControl), wTREM2, control GFP2, mtDAP12 (mtDAP12-GFP), or control GFP1. wTREM2 vector (wTREM2)-transduced microglia phagocytosed significantly more apoptotic neuronal material after 1 and 24 h compared with GFP- (GFP1 or GFP2) or control vector (shControl)-transduced microglia. Control vector (shControl)- and GFP (GFP1 or GFP2)-transduced microglia phagocytosed more apoptotic neuronal material after 1 and 24 h compared with microglia transduced with the TREM2 knockdown (shTREM2) or mtDAP12 (mtDAP12-GFP) vector. Data are presented as mean ± SEM. *, P < 0.02; **, P < 0.05; ***, P < 0.01; Mann-Whitney U test.
Figure 9.
Figure 9.
TREM2 expression determines inflammatory response of microglia during phagocytosis of apoptotic neuronal material. Gene transcription of inflammatory mediators was analyzed by real-time RT-PCR of microglia cocultured with apoptotic neurons. Microglia were transduced with lentiviral vectors producing short hairpin RNAs specific for TREM2 (shTREM2), irrelevant short hairpin RNAs (shControl), wTREM2, control GFP2, mtDAP12 (mtDAP12-GFP), or control GFP1 vector. Relative level of gene transcripts for TNF-α, IL-1β, and NOS2 were increased in microglia transduced with the TREM2 knockdown vector compared with the control vector and decreased in microglia-overexpressing TREM2 compared with the control vector. Data are presented as mean ± SEM. *, P < 0.02; Mann-Whitney U test.

References

    1. Savill, J., I. Dransfield, C. Gregory, and C. Haslett. 2002. A blast from the past: clearance of apoptotic cells regulates immune responses. Nat. Rev. Immunol. 2:965–975. - PubMed
    1. Lauber, K., S.G. Blumenthal, M. Waibel, and S. Wesselborg. 2004. Clearance of apoptotic cells: getting rid of the corpses. Mol. Cell. 14:277–287. - PubMed
    1. Voll, R.E., M. Herrmann, E.A. Roth, C. Stach, J.R. Kalden, and I. Girkontaite. 1997. Immunosuppressive effects of apoptotic cells. Nature. 390:350–351. - PubMed
    1. Fadok, V.A., D.L. Bratton, A. Konowal, P.W. Freed, J.Y. Westcott, and P.M. Henson. 1998. Macrophages that have ingested apoptotic cells in vitro inhibit proinflammatory cytokine production through autocrine/paracrine mechanisms involving TGF-beta, PGE2, and PAF. J. Clin. Invest. 101:890–898. - PMC - PubMed
    1. Cocco, R.E., and D.S. Ucker. 2001. Distinct modes of macrophage recognition for apoptotic and necrotic cells are not specified exclusively by phosphatidylserine exposure. Mol. Biol. Cell. 12:919–930. - PMC - PubMed

Publication types

MeSH terms

Substances