. 2005 Mar 1;102(9):3389-94.
doi: 10.1073/pnas.0409722102. Epub 2005 Feb 22.

Platelet-derived growth factor C induces liver fibrosis, steatosis, and hepatocellular carcinoma

Affiliations

Platelet-derived growth factor C induces liver fibrosis, steatosis, and hepatocellular carcinoma

Jean S Campbell et al. Proc Natl Acad Sci U S A. .

Abstract

Members of the platelet-derived growth factor (PDGF) ligand family are known to play important roles in wound healing and fibrotic disease. We show that both transient and stable expression of PDGF-C results in the development of liver fibrosis consisting of the deposition of collagen in a pericellular and perivenular pattern that resembles human alcoholic and nonalcoholic fatty liver disease. Fibrosis in PDGF-C transgenic mice, as demonstrated by staining and hydroxyproline content, is preceded by activation and proliferation of hepatic stellate cells, as shown by collagen, alpha-smooth muscle actin and glial fibrillary acidic protein staining and between 8 and 12 months of age is followed by the development of liver adenomas and hepatocellular carcinomas. The hepatic expression of a number of known profibrotic genes, including type beta1 TGF, PDGF receptors alpha and beta, and tissue inhibitors of matrix metalloproteinases-1 and -2, increased by 4 weeks of age. Increased PDGF receptor alpha and beta protein levels were associated with activation of extracellular regulated kinase-1 and -2 and protein kinase B. At 9 months of age, PDGF-C transgenic mice had enlarged livers associated with increased fibrosis, steatosis, cell dysplasia, and hepatocellular carcinomas. These studies indicate that hepatic expression of PDGF-C induces a number of profibrotic pathways, suggesting that this growth factor may act as an initiator of fibrosis. Moreover, PDGF-C transgenic mice represent a unique model for the study of hepatic fibrosis progressing to tumorigenesis.


Figures
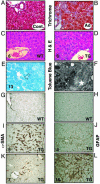
Fig. 1.
Fig. 1.
Histological analysis of livers from mice infected with adenovirus expressing PDGF-C (A and B) and Tg mice overexpressing PDGF-C (C–L) shows HSC activation, proliferation, and hepatic fibrosis. Twenty-one days after infection with adenovirus expressing GFP only (control, A) or human PDGF-C (B), livers were harvested, fixed in formalin, and stained for collagen content with Masson trichrome. Liver tissue from Tg mice overexpressing PDGF-C or WT littermates was harvested at the indicated times (weeks) and stained for hematoxylin/eosin (C and D). Toluene blue staining of thick sections of livers from PDGF-C Tg at 13 weeks of age (E) demonstrates pericellular and perivenular collagen deposition (open arrow). Transmission electron microscopy of an adjacent area to that shown in E illustrates the fibrillar collagen (F, white star). IHC staining for α-SMA is restricted to vascular smooth muscle cells in WT mouse liver at 5 weeks of age (G), compared with the abundant multifocal expression observed in livers of Tg mice of the same age (I). In 7-week-old Tg mice (K), α-SMA expression decreased. IHC staining for GFAP shows increased expression of this marker in perisinusoidal cells in livers from PDGF-C Tg mice at 4 weeks of age (J) with widespread staining at 16 weeks of age (L) but very little staining in non-Tg mice (H). Original magnification is ×400 in A–D and G–L, ×600 in E, and ×31,000 in F.
Fig. 2.
Fig. 2.
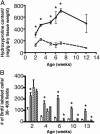
PDGF-C expression induces collagen production and DNA replication in NPC. (A) Collagen content of Tg (filled circles, solid line) and WT (open circles, dashed line) livers. Data are represented as mean hydroxyproline content ± SEM. (B) BrdUrd labeling of NPC (unfilled bars) and hepatocytes (hatched bars) in Tg (gray bars) and WT (white bars) mice. Mean ± SEM are shown for each group (n = 5). *, P ≤ 0.05 for Tg vs. WT mice.
Fig. 3.
Fig. 3.
PDGF-C Tg mice develop fibrosis and steatosis by 9 months. The livers from four different 9-month-old Tg mice were fixed and then stained for α-SMA (A), Masson trichrome (B and C), and Oil red O (D), as described in Materials and Methods. Open arrowheads in A highlight the focal staining for α-SMA, and the black arrow in B indicates bridging fibrosis. Original magnification is ×200 in A, ×20 in B, and ×400 in C and D.
Fig. 4.
Fig. 4.
PDGF-C Tg mice develop HCC. As PDGF-C Tg mice age, their livers become enlarged (A) and show a variety of pathologies, including HCC (black arrow), angiogenesis (white arrow head), and multilocular pseudocysts (speckled arrows). A liver from a WT littermate is shown (Left). Tg mice develop dysplastic foci or foci of altered hepatocytes by 6 months (B), and carcinomas are seen in 12-month-old mice (C). Note the loss of sinusoidal spaces and pseudogland formation in C. Original magnification in B and C is ×100.
Fig. 5.
Fig. 5.
Liver TIMP-1 and -2, TGFβ1, and PDGFRα and -β mRNA levels are elevated in younger PDGF-C Tg mice. Ribonuclease protection assay for TIMP-1 (A) and -2 (B) from 2- to 8-week-old Tg (gray bars) and WT (white bars) mice (C). Relative RT-PCR for TGFβ1 mRNA from 2 to 10 weeks of age. Relative RT-PCR for PDGFRα (D) and -β relative (E) from 2–8 weeks of age. Each mRNA is normalized to a loading control, as described in Materials and Methods. Means ± SEM are shown for each group (n = 4). **, P ≤ 0.001; *, P ≤ 0.05 for Tg vs. WT mice.
Fig. 6.
Fig. 6.
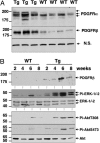
Increased PDGFRα and -β protein is associated with activated ERK-1/-2 and Akt. Protein lysates were made from livers of Tg and WT mice at the indicated ages, and immunoblot analyses were performed as described in Materials and Methods. (A). Livers from Tg (n = 3) and WT (n = 4) mice at 4 weeks of age contain elevated levels of PDGFRα and -β. A nonspecific band (n.s.) was used as loading control. (B). Elevated levels of PDGFRβ protein are detected at all time points (Top). Phosphospecific antibodies detected active (phosphorylated) ERK-1/-2 (Middle) and Akt (Bottom) in the lysates of PDGF-C Tg mice but not in WT mice. Total levels of ERK-1/-2 and Akt are shown.

Similar articles

Cited by

References

    1. Bedossa, P. & Paradis, V. (2003) J. Pathol. 200, 504-515. - PubMed
    1. Rojkind, M., Giambrone, M. A. & Biempica, L. (1979) Gastroenterology 76, 710-719. - PubMed
    1. Milani, S., Herbst, H., Schuppan, D., Hahn, E. G. & Stein, H. (1989) Hepatology 10, 84-92. - PubMed
    1. Friedman, S. L. (1997) Gastroenterology 112, 1406-1409. - PubMed
    1. Hui, A. Y. & Friedman, S. L. (2003) Exp. Rev. Mol. Med. 2003, 1-23. - PubMed

Publication types

Substances