

Study of the high-potential iron sulfur protein in Halorhodospira halophila confirms that it is distinct from cytochrome c as electron carrier
- PMID: 15728382
- PMCID: PMC552902
- DOI: 10.1073/pnas.0407768102
Study of the high-potential iron sulfur protein in Halorhodospira halophila confirms that it is distinct from cytochrome c as electron carrier
Abstract
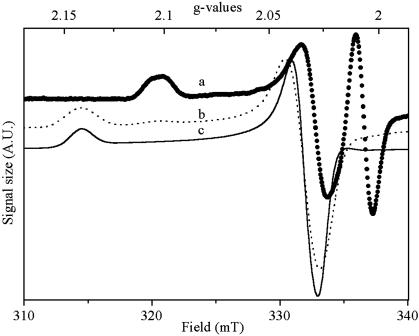
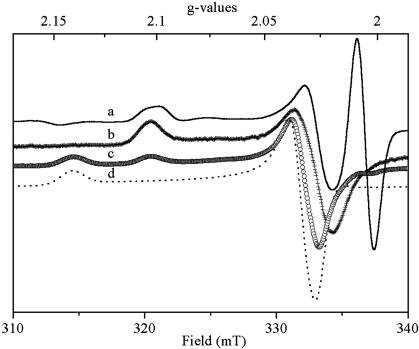
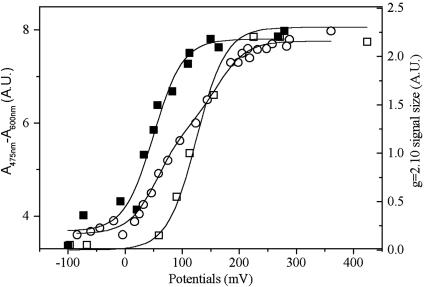
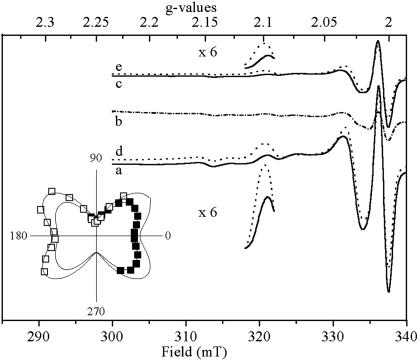
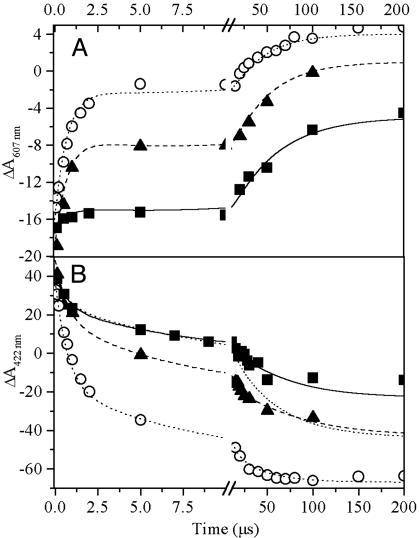
The role of high-potential iron sulfur protein (HiPIP) in donating electrons to the photosynthetic reaction center in the halophilic gamma-proteobacterium Halorhodospira halophila was studied by EPR and time-resolved optical spectroscopy. A tight complex between HiPIP and the reaction center was observed. The EPR spectrum of HiPIP in this complex was drastically different from that of the purified protein and provides an analytical tool for the detection and characterization of the complexed form in samples ranging from whole cells to partially purified protein. The bound HiPIP was identified as iso-HiPIP II. Its Em value at pH 7 in the form bound to the reaction center was approximately 100 mV higher (+140 +/- 20 mV) than that of the purified protein. EPR on oriented samples showed HiPIP II to be bound in a well defined geometry, indicating the presence of specific protein-protein interactions at the docking site. At moderately reducing conditions, the bound HiPIP II donates electrons to the cytochrome subunit bound to the reaction center with a half-time of < or =11 micros. This donation reaction was analyzed by using Marcus's outer-sphere electron-transfer theory and compared with those observed in other HiPIP-containing purple bacteria. The results indicate substantial differences between the HiPIP- and the cytochrome c2-mediated re-reduction of the reaction center.
Figures
Similar articles
-
A Native LH1-RC-HiPIP Supercomplex from an Extremophilic Phototroph.Commun Biol. 2025 Jan 11;8(1):42. doi: 10.1038/s42003-024-07421-w. Commun Biol. 2025. PMID: 39799244 Free PMC article.
-
Two distinct binding sites for high potential iron-sulfur protein and cytochrome c on the reaction center-bound cytochrome of Rubrivivax gelatinosus.J Biol Chem. 2004 Jul 30;279(31):32545-53. doi: 10.1074/jbc.M401784200. Epub 2004 May 19. J Biol Chem. 2004. PMID: 15155756
-
HiPIP in Rubrivivax gelatinosus is firmly associated to the membrane in a conformation efficient for electron transfer towards the photosynthetic reaction centre.Biochim Biophys Acta. 2003 Mar 6;1557(1-3):83-90. doi: 10.1016/s0005-2728(02)00397-3. Biochim Biophys Acta. 2003. PMID: 12615351
-
Type 1 reaction center of photosynthetic heliobacteria.Photochem Photobiol. 2007 Jan-Feb;83(1):177-86. doi: 10.1562/2006-03-29-IR-860. Photochem Photobiol. 2007. PMID: 16842023 Review.
-
Structural and functional studies on the tetraheme cytochrome subunit and its electron donor proteins: the possible docking mechanisms during the electron transfer reaction.Photosynth Res. 2005;85(1):87-99. doi: 10.1007/s11120-004-2416-5. Photosynth Res. 2005. PMID: 15977061 Review.
Cited by
-
Complete genome sequence of Halorhodospira halophila SL1.Stand Genomic Sci. 2013 Apr 15;8(2):206-14. doi: 10.4056/sigs.3677284. eCollection 2013. Stand Genomic Sci. 2013. PMID: 23991253 Free PMC article.
-
Electrochemical and structural characterization of recombinant respiratory proteins of the acidophilic iron oxidizer Ferrovum sp. PN-J47-F6 suggests adaptations to the acidic pH at protein level.Front Microbiol. 2024 Feb 7;15:1357152. doi: 10.3389/fmicb.2024.1357152. eCollection 2024. Front Microbiol. 2024. PMID: 38384274 Free PMC article.
-
A Native LH1-RC-HiPIP Supercomplex from an Extremophilic Phototroph.Commun Biol. 2025 Jan 11;8(1):42. doi: 10.1038/s42003-024-07421-w. Commun Biol. 2025. PMID: 39799244 Free PMC article.
-
Nonredundant roles for cytochrome c2 and two high-potential iron-sulfur proteins in the photoferrotroph Rhodopseudomonas palustris TIE-1.J Bacteriol. 2014 Feb;196(4):850-8. doi: 10.1128/JB.00843-13. Epub 2013 Dec 6. J Bacteriol. 2014. PMID: 24317397 Free PMC article.
-
Tunneling Mechanisms of Quinones in Photosynthetic Reaction Center-Light Harvesting 1 Supercomplexes.Small Sci. 2024 Sep 15;4(11):2400188. doi: 10.1002/smsc.202400188. eCollection 2024 Nov. Small Sci. 2024. PMID: 40213462 Free PMC article.
References
-
- Beinert, H. (2000) J. Biol. Inorg. Chem. 5, 2-15. - PubMed
-
- Carter, C. W., Jr. (2001) in Handbook of Metalloproteins, eds. Messerschmidt, A., Huber, R., Poulos, T. & Wieghardt, K. (Wiley, Chichester, U.K.), pp. 602-609.
-
- Bartsch, R. G. (1991) Biochim. Biophys. Acta 1058, 28-30. - PubMed
-
- Meyer, T. E. (1995) in Anoxygenic Photosynthetic Bacteria, eds. Blankenship, R. E., Madigan, M. T. & Bauer, C. E. (Kluwer, Dordrecht, The Netherlands), Chap. 36, pp. 775-805.
-
- Schoepp, B., Brugna, M., Lebrun, E. & Nitschke, W. (1999) Adv. Inorg. Chem. 47, 335-360.
MeSH terms
Substances
LinkOut - more resources
Full Text Sources
Molecular Biology Databases
Miscellaneous
