. 2005 Mar 22;102(12):4470-5.
doi: 10.1073/pnas.0500670102. Epub 2005 Feb 22.

Quantitative kinetic analysis of the bacteriophage lambda genetic network

Affiliations

Quantitative kinetic analysis of the bacteriophage lambda genetic network

Oren Kobiler et al. Proc Natl Acad Sci U S A. .

Abstract

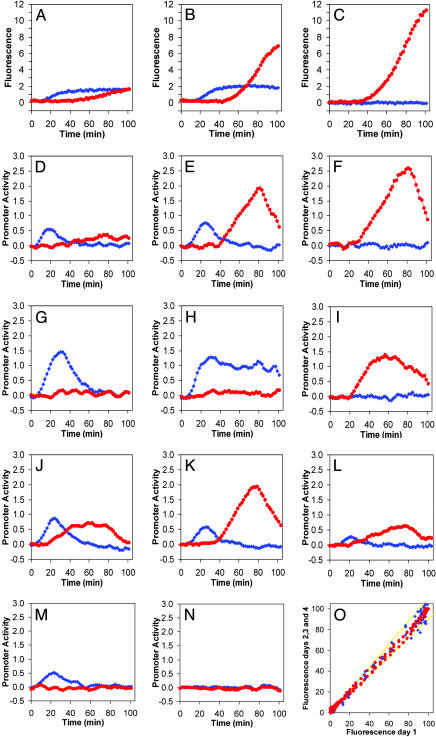
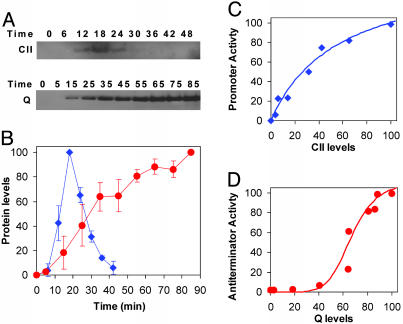
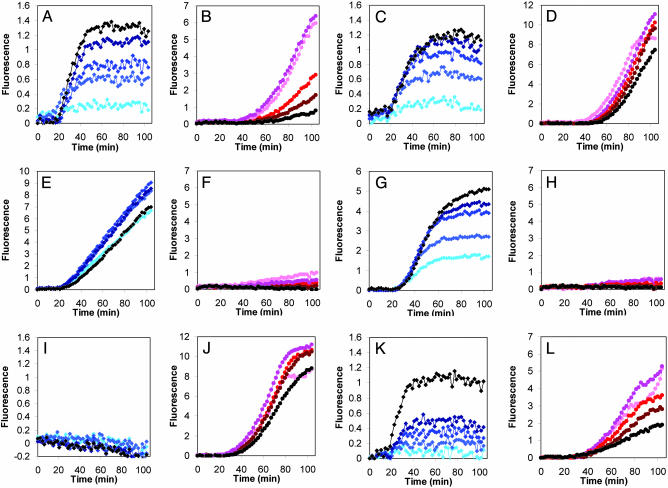
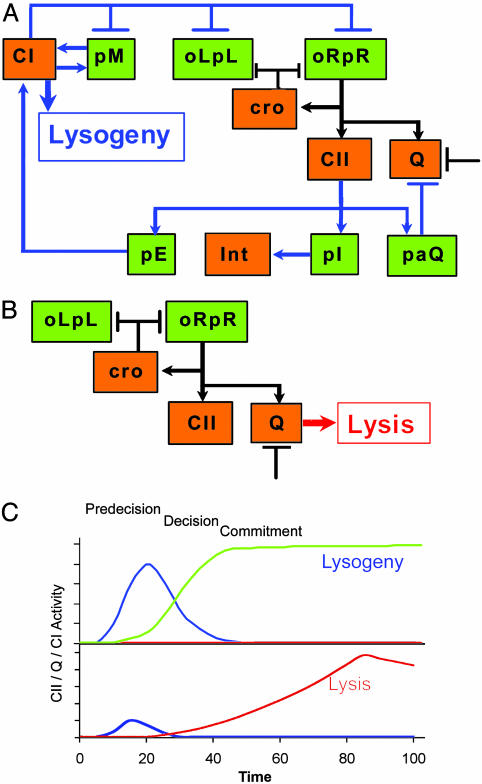
The lysis-lysogeny decision of bacteriophage lambda has been a paradigm for a developmental genetic network, which is composed of interlocked positive and negative feedback loops. This genetic network is capable of responding to environmental signals and to the number of infecting phages. An interplay between CI and Cro functions suggested a bistable switch model for the lysis-lysogeny decision. Here, we present a real-time picture of the execution of lytic and lysogenic pathways with unprecedented temporal resolution. We monitor, in vivo, both the level and function of the CII and Q gene regulators. These activators are cotranscribed yet control opposite developmental pathways. Conditions that favor the lysogenic response show severe delay and down-regulation of Q activity, in both CII-dependent and CII-independent ways. Whereas CII activity correlates with its protein level, Q shows a pronounced threshold before its function is observed. Our quantitative analyses suggest that by regulating CII and CIII, Cro plays a key role in the ability of the lambda genetic network to sense the difference between one and more than one phage particles infecting a cell. Thus, our results provide an improved framework to explain the longstanding puzzle of the decision process.


Figures

Fig. 1.
Fig. 1.
The effect of phage mutants on the kinetics of reporter fusions activation by CII and Q. CII activity is reported by pE-gfp fusions (blue diamonds), whereas Q activity is reported by pR′-tR′-gfp fusions (red circles). (AC) Total fluorescence as function of time of infected cultures with λc+ (A), λcI (B), and λcII (C) mutants. (DN) Promoter activity of pE (blue diamonds) and Q (red circles) as a function of time after infection with λc+ (D), λcI (E), λcII (F), λcro (G), λcrocI (H), λcrocII (I), λpaQ (J), λpE (K), λcIII (L), λQ (M), and λcIIQ (N) mutants. The increase in cell mass, measured by following the optical density at 595 nM, was similar for the first hour in all experiments. All measurements were carried out at a moi of 6. For additional information, see Materials and Methods.(O) Data reproducibility: Normalized fluorescence measured on days 2–4 as function of the normalized fluorescence on day 1. Yellow lines denote 10% deviation limits.
Fig. 2.
Fig. 2.
Promoter activity vs. regulatory protein levels. (A) Western blots for CII after infection with λc+ and Q after infection with λcII carried out on samples taken from multiwell plate experiments at the indicated times and resolved on NuPAGE 4–12% Bis-Tris precast gels (Invitrogen). (B) CII (blue) and Q (red) levels as a function of time. Levels and their SD were determined with the National Institutes of Health image program, from two different experiments. The level of Q protein after infection with λc+ reached ≈20% of that observed in λcII infection (data not shown). (C and D) Promoter activities of pE after infection with λc+ (C) and pR′-tR′ after infection with λcII (D), as calculated from fluorescence measurements, vs. CII and Q concentrations, respectively. Cultures were infected at a moi of 6. Fluorescence measurements and protein levels were measured from the same infections under identical conditions. The lines represent a fit to the data by using a Hill function, with a fitted Hill coefficient H = 0.98 ± 0.15 (C) and H = 6.4 ± 3.3 (D) (see Materials and Methods).
Fig. 3.
Fig. 3.
Effect of moi on regulator activities. Total fluorescence as a function of time from pE-gfp (blue, A, E, I, C, G, and K) and pR′-tR′-gfp fusions (red, B, F, J, D, H, and L) after cell infection with λc+ (A and B), λcI (C and D), λcrocI (E and F), λcro (G and H), λcII (I and J), and λcIII (K and L) mutants, at moi 1, 2, 4, 6, and 10, shown as symbols with increasing color density (brightest represents lowest moi).
Fig. 4.
Fig. 4.
A schematic model for the lysis–lysogeny decision process. (A) Elements of the λ genetic network participating in the lysogenic response. (B) Elements of the λ genetic network active during the lytic pathway. Arrows denote positive actions, and bars denote negative actions. A bar also denotes the threshold or cooperativity effect delaying Q activity. Both schemes focus on functions studied in this work. (Promoters are shown in green, and proteins are shown in orange.) Black connecting lines represent parts of the network operating in both the lytic and the lysogenic response. (C) Simplified kinetic model suggested by our experiments in which CII (blue line) activates CI synthesis (green line) and represses Q activity (red line) during a lysogenic response. When insufficient levels of CII are accumulated, the lytic response is the default of the genetic network.

Comment in

References

    1. Wommack, K. E. & Colwell, R. R. (2000) Microbiol. Mol. Biol. Rev. 64, 69–114. - PMC - PubMed
    1. Hendrix, R. W. (2003) Curr. Opin. Microbiol. 6, 506–511. - PubMed
    1. Friedman, D. I. & Court, D. L. (2001) Curr. Opin. Microbiol. 4, 201–207. - PubMed
    1. Stopar, D., Cerne, A., Zigman, M., Poljsak-Prijatelj, M. & Turk, V. (2003) Microb. Ecol. 46, 249–256. - PubMed
    1. Campbell, A. (2003) Nat. Rev. Genet. 4, 471–477. - PMC - PubMed

Publication types

MeSH terms

LinkOut - more resources